Data
600,315 items of data are available, covering 498,848 participants.
Some values have special meanings defined by Data-Coding
100329.
Defined-instances run from 0 to 3, labelled using Instancing
2.
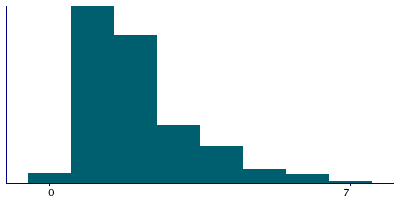
Units of measurement are hours/day.
| Maximum | 24 |
| Decile 9 | 4 |
| Decile 8 | 3 |
| Decile 7 | 2 |
| Decile 6 | 2 |
| Median | 2 |
| Decile 4 | 1 |
| Decile 3 | 1 |
| Decile 2 | 1 |
| Decile 1 | 1 |
| Minimum | 0 |
|
|
- There are 25 distinct values.
- Mean = 2.21587
- Std.dev = 1.80328
- 13591 items above graph maximum of 7
- 92122 items have value -10 (Less than an hour a day)
- 881 items have value -3 (Prefer not to answer)
- 31389 items have value -1 (Do not know)
|
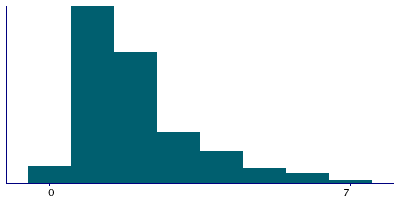
4 Instances
Instance 0 : Initial assessment visit (2006-2010) at which participants were recruited and consent given
497,703 participants, 497,703 items
| Maximum | 24 |
| Decile 9 | 4 |
| Decile 8 | 3 |
| Decile 7 | 2 |
| Decile 6 | 2 |
| Median | 2 |
| Decile 4 | 1 |
| Decile 3 | 1 |
| Decile 2 | 1 |
| Decile 1 | 1 |
| Minimum | 0 |
|
|
- There are 25 distinct values.
- Mean = 2.23798
- Std.dev = 1.85683
- 12358 items above graph maximum of 7
- 78513 items have value -10 (Less than an hour a day)
- 823 items have value -3 (Prefer not to answer)
- 28367 items have value -1 (Do not know)
|
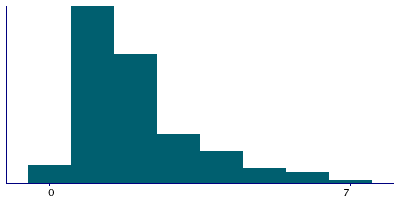
Instance 1 : First repeat assessment visit (2012-13)
20,333 participants, 20,333 items
| Maximum | 22 |
| Decile 9 | 4 |
| Decile 8 | 3 |
| Decile 7 | 2 |
| Decile 6 | 2 |
| Median | 2 |
| Decile 4 | 1 |
| Decile 3 | 1 |
| Decile 2 | 1 |
| Decile 1 | 1 |
| Minimum | 0 |
|
|
- There are 20 distinct values.
- Mean = 1.95664
- Std.dev = 1.54975
- 222 items above graph maximum of 7
- 3901 items have value -10 (Less than an hour a day)
- 13 items have value -3 (Prefer not to answer)
- 758 items have value -1 (Do not know)
|
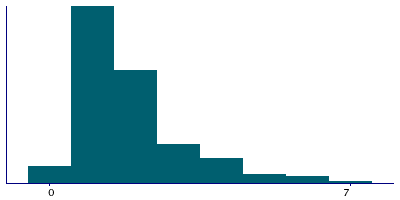
Instance 2 : Imaging visit (2014+)
75,333 participants, 75,333 items
| Maximum | 21 |
| Decile 9 | 4 |
| Decile 8 | 3 |
| Decile 7 | 2 |
| Decile 6 | 2 |
| Median | 2 |
| Decile 4 | 1 |
| Decile 3 | 1 |
| Decile 2 | 1 |
| Decile 1 | 1 |
| Minimum | 0 |
|
|
- There are 19 distinct values.
- Mean = 2.15129
- Std.dev = 1.528
- 937 items above graph maximum of 7
- 8936 items have value -10 (Less than an hour a day)
- 42 items have value -3 (Prefer not to answer)
- 2080 items have value -1 (Do not know)
|
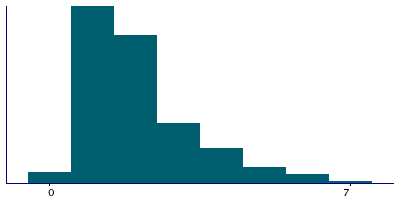
Instance 3 : First repeat imaging visit (2019+)
6,946 participants, 6,946 items
| Maximum | 20 |
| Decile 9 | 4 |
| Decile 8 | 3 |
| Decile 7 | 2 |
| Decile 6 | 2 |
| Median | 2 |
| Decile 4 | 1 |
| Decile 3 | 1 |
| Decile 2 | 1 |
| Decile 1 | 1 |
| Minimum | 0 |
|
|
- There are 16 distinct values.
- Mean = 2.14699
- Std.dev = 1.51561
- 74 items above graph maximum of 7
- 772 items have value -10 (Less than an hour a day)
- 3 items have value -3 (Prefer not to answer)
- 184 items have value -1 (Do not know)
|
Notes
ACE touchscreen question "In a typical DAY in winter, how many hours do you spend outdoors?"
The following checks were performed:
- If answer < 0 then rejected
- If answer > 24 then rejected
- If answer > 10 then participant asked to confirm
If the participant activated the Help button they were shown the message:
If the time you spend outdoors in winter varies a lot, give the
average time per day. For example if you spend 1 hour a day on each
weekday and 4 hours a day on the weekend, the total hours in a week
is 13 (5 + 8), so you spend approximately 2 hours a day.
|
Coding 100329 defines 3 special values:
- -10 represents "Less than an hour a day"
- -1 represents "Do not know"
- -3 represents "Prefer not to answer"
0 Related Data-Fields
There are no related data-fields


