Data
172,005 items of data are available, covering 77,392 participants.
Defined-instances run from 2 to 3, labelled using Instancing
2.
Array indices run from 0 to 5.
Units of measurement are mmHg.
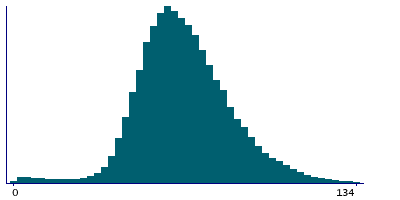
| Maximum | 163 |
| Decile 9 | 91 |
| Decile 8 | 81 |
| Decile 7 | 75 |
| Decile 6 | 70 |
| Median | 65 |
| Decile 4 | 61 |
| Decile 3 | 57 |
| Decile 2 | 53 |
| Decile 1 | 47 |
| Minimum | -107 |
|
|
- There are 192 distinct values.
- Mean = 66.8665
- Std.dev = 18.7581
- 134 items below graph minimum of 0
- 174 items above graph maximum of 135
|
2 Instances
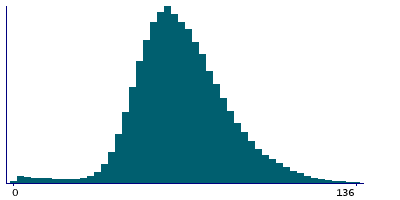
Instance 2 : Imaging visit (2014+)
75,504 participants, 149,153 items
| Maximum | 163 |
| Decile 9 | 91 |
| Decile 8 | 81 |
| Decile 7 | 75 |
| Decile 6 | 70 |
| Median | 66 |
| Decile 4 | 61 |
| Decile 3 | 57 |
| Decile 2 | 53 |
| Decile 1 | 46 |
| Minimum | -107 |
|
|
- There are 190 distinct values.
- Mean = 66.9589
- Std.dev = 18.9053
- 127 items below graph minimum of 0
- 126 items above graph maximum of 136
|
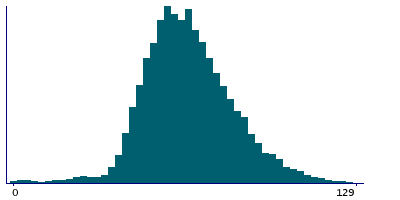
Instance 3 : First repeat imaging visit (2019+)
11,505 participants, 22,852 items
| Maximum | 162 |
| Decile 9 | 89 |
| Decile 8 | 80 |
| Decile 7 | 74 |
| Decile 6 | 69 |
| Median | 65 |
| Decile 4 | 61 |
| Decile 3 | 57 |
| Decile 2 | 53 |
| Decile 1 | 47 |
| Minimum | -19 |
|
|
- There are 154 distinct values.
- Mean = 66.2634
- Std.dev = 17.7554
- 7 items below graph minimum of 0
- 38 items above graph maximum of 131
|
Notes
Central pulse pressure during PWA
0 Related Data-Fields
There are no related data-fields

