Data
87,520 items of data are available, covering 77,785 participants.
Defined-instances run from 2 to 3, labelled using Instancing
2.
Units of measurement are mmHg.
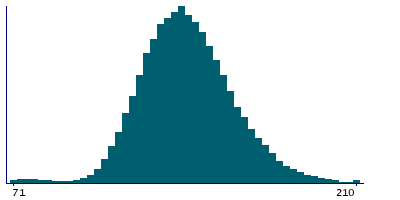
| Maximum | 210 |
| Decile 9 | 166 |
| Decile 8 | 156 |
| Decile 7 | 150 |
| Decile 6 | 145 |
| Median | 140 |
| Decile 4 | 136 |
| Decile 3 | 131 |
| Decile 2 | 126 |
| Decile 1 | 118 |
| Minimum | 8 |
|
|
- There are 202 distinct values.
- Mean = 140.391
- Std.dev = 21.3873
- 925 items below graph minimum of 70
|
2 Instances
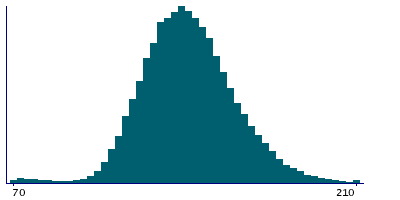
Instance 2 : Imaging visit (2014+)
75,978 participants, 75,978 items
| Maximum | 210 |
| Decile 9 | 166 |
| Decile 8 | 157 |
| Decile 7 | 150 |
| Decile 6 | 145 |
| Median | 140 |
| Decile 4 | 136 |
| Decile 3 | 131 |
| Decile 2 | 126 |
| Decile 1 | 118 |
| Minimum | 8 |
|
|
- There are 202 distinct values.
- Mean = 140.516
- Std.dev = 21.4728
- 825 items below graph minimum of 70
|
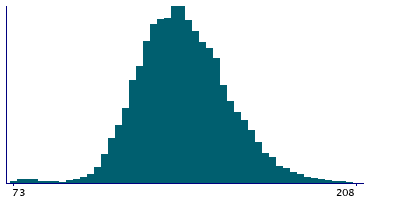
Instance 3 : First repeat imaging visit (2019+)
11,542 participants, 11,542 items
| Maximum | 210 |
| Decile 9 | 164 |
| Decile 8 | 155 |
| Decile 7 | 149 |
| Decile 6 | 144 |
| Median | 140 |
| Decile 4 | 135 |
| Decile 3 | 130 |
| Decile 2 | 125 |
| Decile 1 | 118 |
| Minimum | 11 |
|
|
- There are 180 distinct values.
- Mean = 139.57
- Std.dev = 20.7965
- 128 items below graph minimum of 72
|
Notes
Systolic brachial blood pressure during blood pressure test.
0 Related Data-Fields
There are no related data-fields

