Data
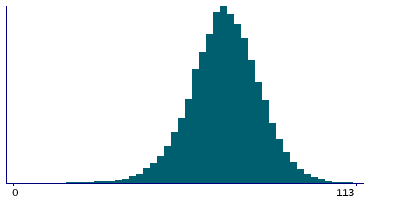
104,540 items of data are available, covering 88,456 participants.
Defined-instances run from 2 to 3, labelled using Instancing
2.
Units of measurement are mmHg.
| Maximum | 188 |
| Decile 9 | 84 |
| Decile 8 | 79 |
| Decile 7 | 75 |
| Decile 6 | 72 |
| Median | 70 |
| Decile 4 | 67 |
| Decile 3 | 64 |
| Decile 2 | 60 |
| Decile 1 | 55 |
| Minimum | 11 |
|
|
- There are 162 distinct values.
- Mean = 69.4383
- Std.dev = 11.9174
- 133 items above graph maximum of 113
|
2 Instances
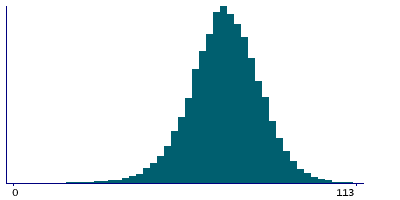
Instance 2 : Imaging visit (2014+)
85,897 participants, 85,897 items
| Maximum | 188 |
| Decile 9 | 84 |
| Decile 8 | 79 |
| Decile 7 | 75 |
| Decile 6 | 72 |
| Median | 70 |
| Decile 4 | 67 |
| Decile 3 | 64 |
| Decile 2 | 60 |
| Decile 1 | 55 |
| Minimum | 11 |
|
|
- There are 159 distinct values.
- Mean = 69.4873
- Std.dev = 12.1271
- 116 items above graph maximum of 113
|
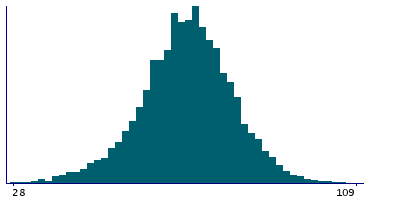
Instance 3 : First repeat imaging visit (2019+)
18,643 participants, 18,643 items
| Maximum | 188 |
| Decile 9 | 82 |
| Decile 8 | 78 |
| Decile 7 | 74 |
| Decile 6 | 72 |
| Median | 69 |
| Decile 4 | 67 |
| Decile 3 | 64 |
| Decile 2 | 61 |
| Decile 1 | 56 |
| Minimum | 14 |
|
|
- There are 111 distinct values.
- Mean = 69.2126
- Std.dev = 10.8966
- 36 items below graph minimum of 30
- 24 items above graph maximum of 108
|
Notes
Diastolic brachial blood pressure during blood pressure test.
0 Related Data-Fields
There are no related data-fields

