Data
418,943 items of data are available, covering 350,226 participants.
Some values have special meanings defined by Data-Coding
100291.
Defined-instances run from 0 to 3, labelled using Instancing
2.
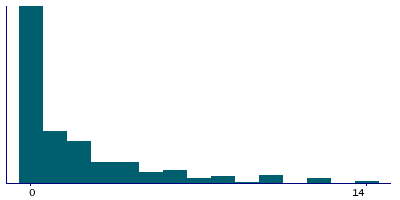
Units of measurement are pints.
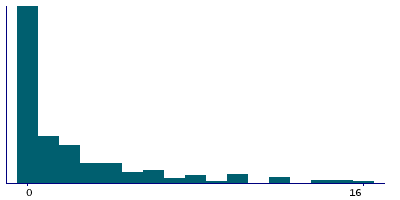
| Maximum | 210 |
| Decile 9 | 8 |
| Decile 8 | 4 |
| Decile 7 | 3 |
| Decile 6 | 2 |
| Median | 1 |
| Decile 4 | 0 |
| Decile 3 | 0 |
| Decile 2 | 0 |
| Decile 1 | 0 |
| Minimum | 0 |
|
|
- There are 73 distinct values.
- Mean = 2.89303
- Std.dev = 5.38679
- 12498 items above graph maximum of 16
- 358 items have value -3 (Prefer not to answer)
- 1187 items have value -1 (Do not know)
|
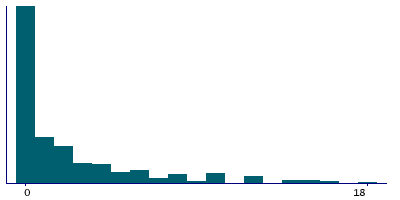
4 Instances
Instance 0 : Initial assessment visit (2006-2010) at which participants were recruited and consent given
346,411 participants, 346,411 items
| Maximum | 210 |
| Decile 9 | 9 |
| Decile 8 | 5 |
| Decile 7 | 3 |
| Decile 6 | 2 |
| Median | 1 |
| Decile 4 | 0 |
| Decile 3 | 0 |
| Decile 2 | 0 |
| Decile 1 | 0 |
| Minimum | 0 |
|
|
- There are 73 distinct values.
- Mean = 3.01302
- Std.dev = 5.60505
- 10185 items above graph maximum of 18
- 330 items have value -3 (Prefer not to answer)
- 1090 items have value -1 (Do not know)
|
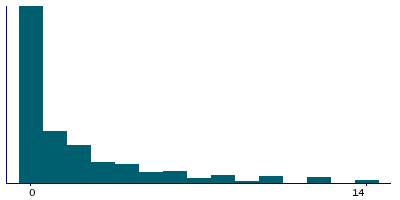
Instance 1 : First repeat assessment visit (2012-13)
14,508 participants, 14,508 items
| Maximum | 55 |
| Decile 9 | 7 |
| Decile 8 | 4 |
| Decile 7 | 2 |
| Decile 6 | 1 |
| Median | 1 |
| Decile 4 | 0 |
| Decile 3 | 0 |
| Decile 2 | 0 |
| Decile 1 | 0 |
| Minimum | 0 |
|
|
- There are 37 distinct values.
- Mean = 2.47528
- Std.dev = 4.48993
- 421 items above graph maximum of 14
- 6 items have value -3 (Prefer not to answer)
- 22 items have value -1 (Do not know)
|
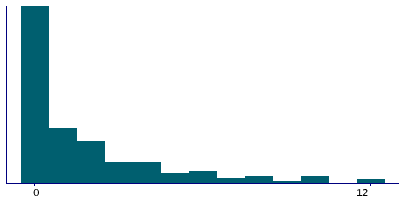
Instance 2 : Imaging visit (2014+)
53,101 participants, 53,101 items
| Maximum | 80 |
| Decile 9 | 6 |
| Decile 8 | 4 |
| Decile 7 | 2 |
| Decile 6 | 1 |
| Median | 1 |
| Decile 4 | 0 |
| Decile 3 | 0 |
| Decile 2 | 0 |
| Decile 1 | 0 |
| Minimum | 0 |
|
|
- There are 45 distinct values.
- Mean = 2.27793
- Std.dev = 4.06343
- 1545 items above graph maximum of 12
- 20 items have value -3 (Prefer not to answer)
- 68 items have value -1 (Do not know)
|
Instance 3 : First repeat imaging visit (2019+)
4,923 participants, 4,923 items
| Maximum | 45 |
| Decile 9 | 7 |
| Decile 8 | 4 |
| Decile 7 | 2 |
| Decile 6 | 1 |
| Median | 1 |
| Decile 4 | 0 |
| Decile 3 | 0 |
| Decile 2 | 0 |
| Decile 1 | 0 |
| Minimum | 0 |
|
|
- There are 30 distinct values.
- Mean = 2.33537
- Std.dev = 3.9601
- 105 items above graph maximum of 14
- 2 items have value -3 (Prefer not to answer)
- 7 items have value -1 (Do not know)
|
Notes
ACE touchscreen question "In an average WEEK, how many pints of beer or cider would you drink? (Include bitter, lager, stout, ale, Guinness)"
The following checks were performed:
- If answer < 0 then rejected
- If answer > 250 then rejected
- If answer > 100 then participant asked to confirm
Field 1588 was collected from participants who indicated they drink alcohol more often than one to three times per month, as defined by their answers to Field 1558
Coding 100291 defines 2 special values:
- -1 represents "Do not know"
- -3 represents "Prefer not to answer"
1 Related Data-Field
| Field ID | Description | Relationship |
|---|
| 1558 | Alcohol intake frequency. | Current Field was collected from participants who indicated they drink alcohol more often than once or twice a week, as defined by their answers to Field 1558 |


