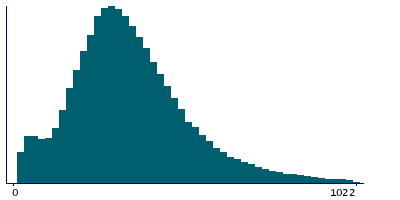
Data
47,717 items of data are available, covering 46,981 participants.
Defined-instances run from 2 to 3, labelled using Instancing
2.
Units of measurement are seconds.
| Maximum | 4224 |
| Decile 9 | 631 |
| Decile 8 | 515 |
| Decile 7 | 451 |
| Decile 6 | 403 |
| Median | 364 |
| Decile 4 | 329 |
| Decile 3 | 296 |
| Decile 2 | 263 |
| Decile 1 | 223 |
| Minimum | 76 |
|
|
- There are 1246 distinct values.
- Mean = 404.519
- Std.dev = 185.435
- 521 items above graph maximum of 1039
|
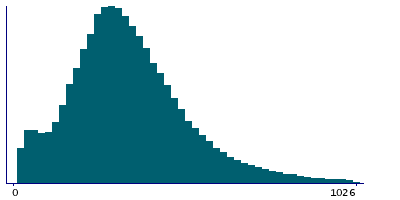
2 Instances
Instance 2 : Imaging visit (2014+)
40,728 participants, 40,728 items
| Maximum | 4224 |
| Decile 9 | 634 |
| Decile 8 | 521 |
| Decile 7 | 456 |
| Decile 6 | 409 |
| Median | 370 |
| Decile 4 | 335 |
| Decile 3 | 303 |
| Decile 2 | 268 |
| Decile 1 | 229 |
| Minimum | 76 |
|
|
- There are 1202 distinct values.
- Mean = 409.287
- Std.dev = 183.285
- 435 items above graph maximum of 1039
|
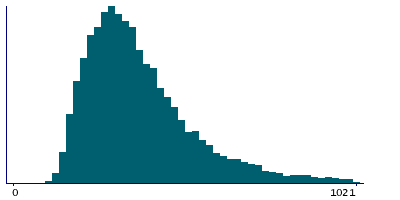
Instance 3 : First repeat imaging visit (2019+)
6,989 participants, 6,989 items
| Maximum | 2914 |
| Decile 9 | 610 |
| Decile 8 | 481 |
| Decile 7 | 415 |
| Decile 6 | 366 |
| Median | 329 |
| Decile 4 | 295 |
| Decile 3 | 265 |
| Decile 2 | 232 |
| Decile 1 | 198 |
| Minimum | 99 |
|
|
- There are 863 distinct values.
- Mean = 376.737
- Std.dev = 195.192
- 95 items above graph maximum of 1022
|
Notes
Imaging screening duration
0 Related Data-Fields
There are no related data-fields
0 Resources
There are no matching Resources
