Data
74,616 items of data are available, covering 69,208 participants.
Defined-instances run from 2 to 3, labelled using Instancing
2.
Units of measurement are g/cm2.
| Maximum | 1.9324 |
| Decile 9 | 1.1221 |
| Decile 8 | 1.04987 |
| Decile 7 | 0.998571 |
| Decile 6 | 0.957521 |
| Median | 0.919975 |
| Decile 4 | 0.883896 |
| Decile 3 | 0.84728 |
| Decile 2 | 0.806893 |
| Decile 1 | 0.755383 |
| Minimum | 0 |
|

|
- Mean = 0.931382
- Std.dev = 0.144808
- 10 items below graph minimum of 0.388663
- 73 items above graph maximum of 1.48882
|
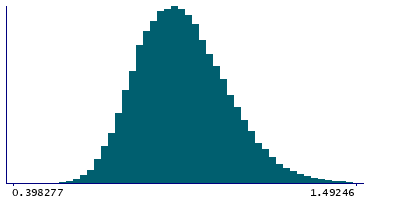
2 Instances
Instance 2 : Imaging visit (2014+)
68,859 participants, 68,859 items
| Maximum | 1.9324 |
| Decile 9 | 1.12258 |
| Decile 8 | 1.05012 |
| Decile 7 | 0.998682 |
| Decile 6 | 0.957511 |
| Median | 0.919916 |
| Decile 4 | 0.883842 |
| Decile 3 | 0.847022 |
| Decile 2 | 0.806637 |
| Decile 1 | 0.755383 |
| Minimum | 0 |
|
|
- Mean = 0.931381
- Std.dev = 0.145056
- 10 items below graph minimum of 0.388184
- 70 items above graph maximum of 1.48978
|
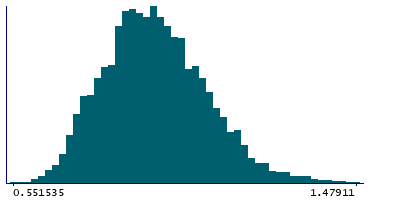
Instance 3 : First repeat imaging visit (2019+)
5,757 participants, 5,757 items
| Maximum | 1.79903 |
| Decile 9 | 1.11802 |
| Decile 8 | 1.04745 |
| Decile 7 | 0.997863 |
| Decile 6 | 0.957795 |
| Median | 0.92052 |
| Decile 4 | 0.884498 |
| Decile 3 | 0.850426 |
| Decile 2 | 0.810899 |
| Decile 1 | 0.75539 |
| Minimum | 0.465101 |
|
|
- Mean = 0.931388
- Std.dev = 0.141806
- 4 items above graph maximum of 1.48065
|