Data
51,761 items of data are available, covering 48,174 participants.
Defined-instances run from 2 to 3, labelled using Instancing
2.
Units of measurement are g/cm2.
| Maximum | 3.15733 |
| Decile 9 | 1.03509 |
| Decile 8 | 0.97333 |
| Decile 7 | 0.92513 |
| Decile 6 | 0.880575 |
| Median | 0.838951 |
| Decile 4 | 0.798063 |
| Decile 3 | 0.755664 |
| Decile 2 | 0.710991 |
| Decile 1 | 0.654829 |
| Minimum | 0 |
|

|
- Mean = 0.843205
- Std.dev = 0.146115
- 6 items above graph maximum of 1.41535
|
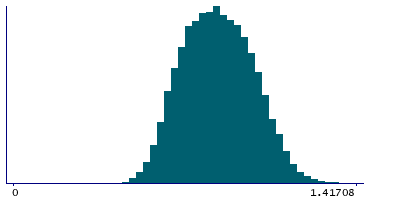
2 Instances
Instance 2 : Imaging visit (2014+)
47,745 participants, 47,745 items
| Maximum | 3.15733 |
| Decile 9 | 1.03624 |
| Decile 8 | 0.973962 |
| Decile 7 | 0.925732 |
| Decile 6 | 0.881377 |
| Median | 0.839544 |
| Decile 4 | 0.798637 |
| Decile 3 | 0.756476 |
| Decile 2 | 0.711479 |
| Decile 1 | 0.655399 |
| Minimum | 0 |
|
|
- Mean = 0.843901
- Std.dev = 0.146382
- 6 items above graph maximum of 1.41708
|
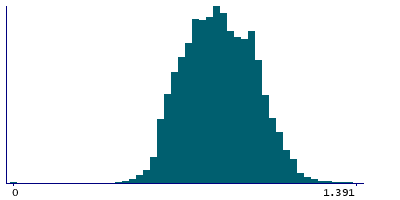
Instance 3 : First repeat imaging visit (2019+)
4,016 participants, 4,016 items
| Maximum | 1.41117 |
| Decile 9 | 1.02029 |
| Decile 8 | 0.9653 |
| Decile 7 | 0.918401 |
| Decile 6 | 0.872435 |
| Median | 0.831168 |
| Decile 4 | 0.791771 |
| Decile 3 | 0.748844 |
| Decile 2 | 0.704169 |
| Decile 1 | 0.649581 |
| Minimum | 0 |
|
|
- Mean = 0.83493
- Std.dev = 0.142633
- 1 item above graph maximum of 1.391
|