Data
78,765 items of data are available, covering 72,674 participants.
Defined-instances run from 2 to 3, labelled using Instancing
2.
Units of measurement are g.
| Maximum | 1841.43 |
| Decile 9 | 1046.25 |
| Decile 8 | 940.07 |
| Decile 7 | 863.419 |
| Decile 6 | 797.109 |
| Median | 736.052 |
| Decile 4 | 678.939 |
| Decile 3 | 625.529 |
| Decile 2 | 572.345 |
| Decile 1 | 511.41 |
| Minimum | 0 |
|

|
- Mean = 760.554
- Std.dev = 207.545
- 37 items above graph maximum of 1581.09
|
2 Instances
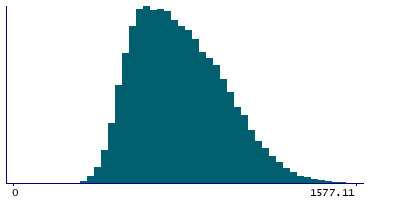
Instance 2 : Imaging visit (2014+)
72,404 participants, 72,404 items
| Maximum | 1841.43 |
| Decile 9 | 1046.55 |
| Decile 8 | 940.094 |
| Decile 7 | 863.675 |
| Decile 6 | 797.296 |
| Median | 735.878 |
| Decile 4 | 678.87 |
| Decile 3 | 625.278 |
| Decile 2 | 572.102 |
| Decile 1 | 511.253 |
| Minimum | 0 |
|
|
- Mean = 760.567
- Std.dev = 207.69
- 32 items above graph maximum of 1581.85
|
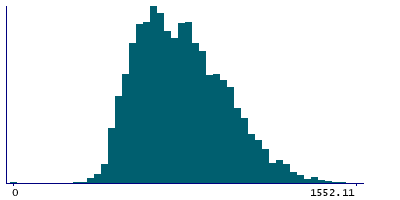
Instance 3 : First repeat imaging visit (2019+)
6,361 participants, 6,361 items
| Maximum | 1741.79 |
| Decile 9 | 1040.32 |
| Decile 8 | 939.626 |
| Decile 7 | 860.938 |
| Decile 6 | 795.54 |
| Median | 737.951 |
| Decile 4 | 679.839 |
| Decile 3 | 627.839 |
| Decile 2 | 574.529 |
| Decile 1 | 513.493 |
| Minimum | 0 |
|
|
- Mean = 760.413
- Std.dev = 205.888
- 6 items above graph maximum of 1567.15
|