Data
78,150 items of data are available, covering 72,120 participants.
Defined-instances run from 2 to 3, labelled using Instancing
2.
Units of measurement are g/cm2.
| Maximum | 2.3604 |
| Decile 9 | 1.40618 |
| Decile 8 | 1.31789 |
| Decile 7 | 1.25489 |
| Decile 6 | 1.20258 |
| Median | 1.1544 |
| Decile 4 | 1.10676 |
| Decile 3 | 1.05721 |
| Decile 2 | 1.00246 |
| Decile 1 | 0.9284 |
| Minimum | 0 |
|
|
- Mean = 1.16251
- Std.dev = 0.187124
- 51 items above graph maximum of 1.88396
|
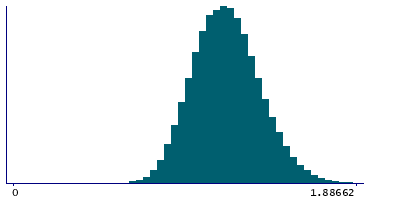
2 Instances
Instance 2 : Imaging visit (2014+)
71,842 participants, 71,842 items
| Maximum | 2.3604 |
| Decile 9 | 1.40684 |
| Decile 8 | 1.31819 |
| Decile 7 | 1.25523 |
| Decile 6 | 1.20282 |
| Median | 1.15451 |
| Decile 4 | 1.10691 |
| Decile 3 | 1.05715 |
| Decile 2 | 1.00237 |
| Decile 1 | 0.928247 |
| Minimum | 0 |
|

|
- Mean = 1.16269
- Std.dev = 0.187441
- 49 items above graph maximum of 1.88542
|
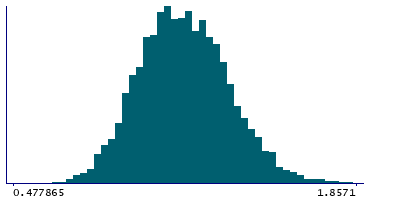
Instance 3 : First repeat imaging visit (2019+)
6,308 participants, 6,308 items
| Maximum | 2.1551 |
| Decile 9 | 1.40092 |
| Decile 8 | 1.31279 |
| Decile 7 | 1.25083 |
| Decile 6 | 1.20031 |
| Median | 1.15287 |
| Decile 4 | 1.10504 |
| Decile 3 | 1.05871 |
| Decile 2 | 1.00361 |
| Decile 1 | 0.930603 |
| Minimum | 0 |
|
|
- Mean = 1.1605
- Std.dev = 0.183456
- 3 items above graph maximum of 1.87124
|