Data
39,618 items of data are available, covering 37,214 participants.
Defined-instances run from 2 to 3, labelled using Instancing
2.
Units of measurement are cm2.
| Maximum | 333.501 |
| Decile 9 | 233.546 |
| Decile 8 | 220.341 |
| Decile 7 | 209.948 |
| Decile 6 | 199.548 |
| Median | 188.927 |
| Decile 4 | 178.678 |
| Decile 3 | 169.842 |
| Decile 2 | 161.495 |
| Decile 1 | 152.063 |
| Minimum | 21.8865 |
|
|
- Mean = 191.221
- Std.dev = 31.8102
- 4 items above graph maximum of 315.03
|
2 Instances
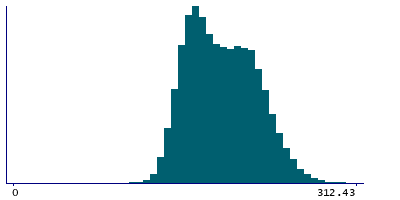
Instance 2 : Imaging visit (2014+)
35,837 participants, 35,837 items
| Maximum | 330.568 |
| Decile 9 | 233.346 |
| Decile 8 | 220.068 |
| Decile 7 | 209.649 |
| Decile 6 | 199.326 |
| Median | 188.63 |
| Decile 4 | 178.407 |
| Decile 3 | 169.616 |
| Decile 2 | 161.386 |
| Decile 1 | 151.975 |
| Minimum | 21.8865 |
|

|
- Mean = 190.995
- Std.dev = 31.7472
- 2 items above graph maximum of 314.717
|
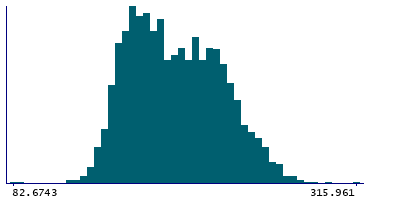
Instance 3 : First repeat imaging visit (2019+)
3,781 participants, 3,781 items
| Maximum | 333.501 |
| Decile 9 | 235.909 |
| Decile 8 | 222.798 |
| Decile 7 | 212.686 |
| Decile 6 | 202.416 |
| Median | 191.243 |
| Decile 4 | 181.142 |
| Decile 3 | 171.778 |
| Decile 2 | 162.819 |
| Decile 1 | 153.078 |
| Minimum | 61.1015 |
|
|
- Mean = 193.366
- Std.dev = 32.3225
- 2 items above graph maximum of 318.739
|