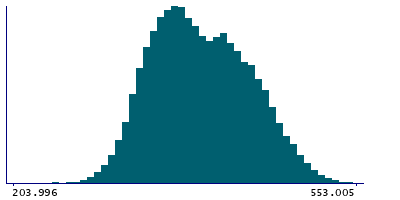
Data
27,256 items of data are available, covering 26,268 participants.
Defined-instances run from 2 to 3, labelled using Instancing
2.
Units of measurement are cm2.
| Maximum | 553.005 |
| Decile 9 | 461.871 |
| Decile 8 | 440.169 |
| Decile 7 | 422.476 |
| Decile 6 | 406.773 |
| Median | 390.783 |
| Decile 4 | 376.46 |
| Decile 3 | 363.227 |
| Decile 2 | 349.641 |
| Decile 1 | 332.933 |
| Minimum | 78.2767 |
|
|
- Mean = 394.523
- Std.dev = 49.2853
- 2 items below graph minimum of 203.996
|
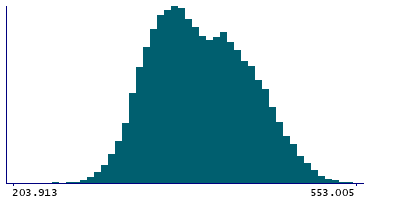
2 Instances
Instance 2 : Imaging visit (2014+)
25,272 participants, 25,272 items
| Maximum | 553.005 |
| Decile 9 | 461.809 |
| Decile 8 | 440.132 |
| Decile 7 | 422.457 |
| Decile 6 | 406.773 |
| Median | 390.75 |
| Decile 4 | 376.301 |
| Decile 3 | 363.122 |
| Decile 2 | 349.479 |
| Decile 1 | 332.861 |
| Minimum | 78.2767 |
|
|
- Mean = 394.451
- Std.dev = 49.2809
- 2 items below graph minimum of 203.913
|
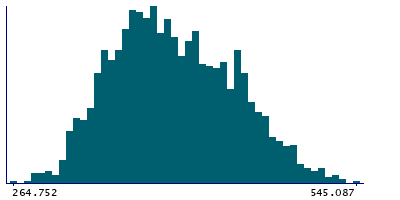
Instance 3 : First repeat imaging visit (2019+)
1,984 participants, 1,984 items
| Maximum | 545.087 |
| Decile 9 | 462.731 |
| Decile 8 | 441.83 |
| Decile 7 | 423.08 |
| Decile 6 | 406.792 |
| Median | 391.064 |
| Decile 4 | 377.842 |
| Decile 3 | 364.843 |
| Decile 2 | 351.051 |
| Decile 1 | 333.494 |
| Minimum | 264.752 |
|
|
- Mean = 395.449
- Std.dev = 49.3315
|