Data
86,657 items of data are available, covering 82,012 participants.
Defined-instances run from 2 to 3, labelled using Instancing
2.
Units of measurement are mm3.
| Maximum | 867269 |
| Decile 9 | 663018 |
| Decile 8 | 644975 |
| Decile 7 | 631521 |
| Decile 6 | 620025 |
| Median | 609279 |
| Decile 4 | 598569 |
| Decile 3 | 587219 |
| Decile 2 | 573875 |
| Decile 1 | 555207 |
| Minimum | 383438 |
|
|
- Mean = 609096
- Std.dev = 42169.1
- 18 items below graph minimum of 447395
- 2 items above graph maximum of 770830
|
2 Instances
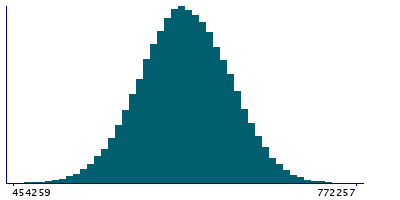
Instance 2 : Imaging visit (2014+)
81,876 participants, 81,876 items
| Maximum | 867269 |
| Decile 9 | 662780 |
| Decile 8 | 644616 |
| Decile 7 | 631165 |
| Decile 6 | 619596 |
| Median | 608921 |
| Decile 4 | 598206 |
| Decile 3 | 586778 |
| Decile 2 | 573434 |
| Decile 1 | 554807 |
| Minimum | 383438 |
|

|
- Mean = 608733
- Std.dev = 42248.8
- 16 items below graph minimum of 446833
- 2 items above graph maximum of 770753
|
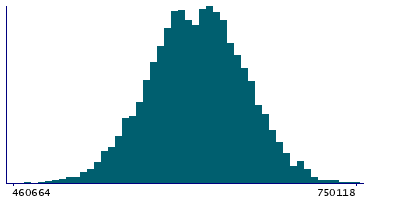
Instance 3 : First repeat imaging visit (2019+)
4,781 participants, 4,781 items
| Maximum | 750118 |
| Decile 9 | 666436 |
| Decile 8 | 649631 |
| Decile 7 | 637492 |
| Decile 6 | 626519 |
| Median | 616195 |
| Decile 4 | 604521 |
| Decile 3 | 594063 |
| Decile 2 | 581604 |
| Decile 1 | 563550 |
| Minimum | 443497 |
|
|
- Mean = 615303
- Std.dev = 40277.3
- 2 items below graph minimum of 460664
|
Notes
Volume of peripheral cortical grey matter (from T1 brain image, normalised for head size)
0 Related Data-Fields
There are no related data-fields


