Data
78,625 items of data are available, covering 74,332 participants.
Defined-instances run from 2 to 3, labelled using Instancing
2.
Units of measurement are ms.
| Maximum | 61.1734 |
| Decile 9 | 51.7215 |
| Decile 8 | 50.0377 |
| Decile 7 | 48.7507 |
| Decile 6 | 47.5916 |
| Median | 46.4385 |
| Decile 4 | 45.2048 |
| Decile 3 | 43.7956 |
| Decile 2 | 41.9964 |
| Decile 1 | 39.2766 |
| Minimum | 0 |
|

|
- Mean = 45.8313
- Std.dev = 5.10178
- 264 items below graph minimum of 26.8316
|
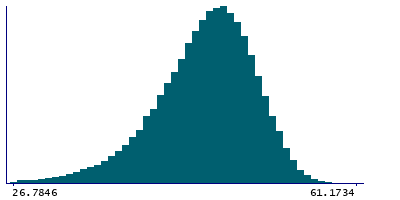
2 Instances
Instance 2 : Imaging visit (2014+)
73,987 participants, 73,987 items
| Maximum | 61.1734 |
| Decile 9 | 51.7106 |
| Decile 8 | 50.0205 |
| Decile 7 | 48.7325 |
| Decile 6 | 47.567 |
| Median | 46.4114 |
| Decile 4 | 45.1831 |
| Decile 3 | 43.7685 |
| Decile 2 | 41.9557 |
| Decile 1 | 39.2259 |
| Minimum | 0 |
|
|
- Mean = 45.8046
- Std.dev = 5.11105
- 244 items below graph minimum of 26.7412
|
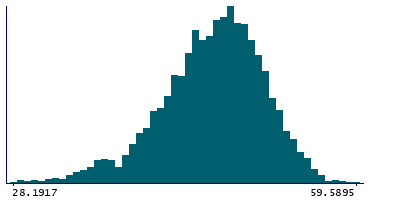
Instance 3 : First repeat imaging visit (2019+)
4,638 participants, 4,638 items
| Maximum | 59.5895 |
| Decile 9 | 51.9134 |
| Decile 8 | 50.2663 |
| Decile 7 | 49.0503 |
| Decile 6 | 47.9444 |
| Median | 46.819 |
| Decile 4 | 45.5332 |
| Decile 3 | 44.2953 |
| Decile 2 | 42.63 |
| Decile 1 | 40.0514 |
| Minimum | 0 |
|
|
- Mean = 46.2568
- Std.dev = 4.93207
- 21 items below graph minimum of 28.1894
|
Notes
Median T2star in right amygdala (from SWI data)
0 Related Data-Fields
There are no related data-fields


