Data
55,959 items of data are available, covering 52,097 participants.
Defined-instances run from 2 to 3, labelled using Instancing
2.
Units of measurement are percent.
| Maximum | 8.295 |
| Decile 9 | 0.99 |
| Decile 8 | 0.848 |
| Decile 7 | 0.753 |
| Decile 6 | 0.674 |
| Median | 0.602 |
| Decile 4 | 0.529 |
| Decile 3 | 0.452 |
| Decile 2 | 0.357 |
| Decile 1 | 0.213 |
| Minimum | -13.89 |
|
|
- Mean = 0.595841
- Std.dev = 0.346005
- 212 items below graph minimum of -0.564
- 69 items above graph maximum of 1.767
|
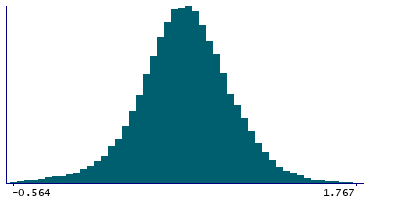
2 Instances
Instance 2 : Imaging visit (2014+)
51,673 participants, 51,673 items
| Maximum | 8.295 |
| Decile 9 | 0.992 |
| Decile 8 | 0.851 |
| Decile 7 | 0.756 |
| Decile 6 | 0.676 |
| Median | 0.604 |
| Decile 4 | 0.531 |
| Decile 3 | 0.453 |
| Decile 2 | 0.358 |
| Decile 1 | 0.213 |
| Minimum | -13.89 |
|

|
- Mean = 0.597594
- Std.dev = 0.348288
- 198 items below graph minimum of -0.566
- 64 items above graph maximum of 1.771
|
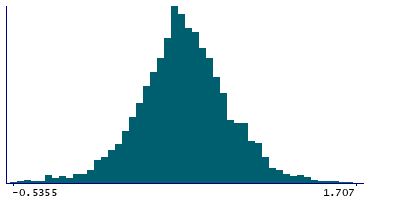
Instance 3 : First repeat imaging visit (2019+)
4,286 participants, 4,286 items
| Maximum | 4.195 |
| Decile 9 | 0.9595 |
| Decile 8 | 0.8075 |
| Decile 7 | 0.7185 |
| Decile 6 | 0.642 |
| Median | 0.573 |
| Decile 4 | 0.513 |
| Decile 3 | 0.4415 |
| Decile 2 | 0.347 |
| Decile 1 | 0.212 |
| Minimum | -1.652 |
|
|
- Mean = 0.574706
- Std.dev = 0.316435
- 14 items below graph minimum of -0.5355
- 6 items above graph maximum of 1.707
|