Data
64,947 items of data are available, covering 60,419 participants.
Defined-instances run from 2 to 3, labelled using Instancing
2.
Units of measurement are AU.
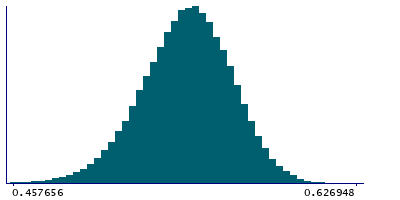
| Maximum | 0.730463 |
| Decile 9 | 0.570518 |
| Decile 8 | 0.561765 |
| Decile 7 | 0.555092 |
| Decile 6 | 0.549333 |
| Median | 0.543887 |
| Decile 4 | 0.538327 |
| Decile 3 | 0.532191 |
| Decile 2 | 0.524715 |
| Decile 1 | 0.514087 |
| Minimum | 0 |
|
|
- Mean = 0.542742
- Std.dev = 0.023209
- 136 items below graph minimum of 0.457656
- 1 item above graph maximum of 0.626948
|
2 Instances
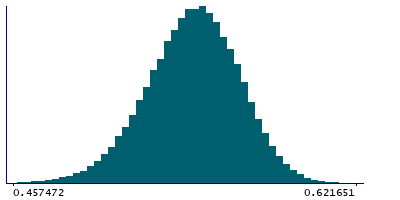
Instance 2 : Imaging visit (2014+)
60,187 participants, 60,187 items
| Maximum | 0.621651 |
| Decile 9 | 0.570644 |
| Decile 8 | 0.561892 |
| Decile 7 | 0.555232 |
| Decile 6 | 0.549459 |
| Median | 0.54401 |
| Decile 4 | 0.538413 |
| Decile 3 | 0.532242 |
| Decile 2 | 0.524751 |
| Decile 1 | 0.514058 |
| Minimum | 0 |
|
|
- Mean = 0.54281
- Std.dev = 0.0233009
- 127 items below graph minimum of 0.457472
|
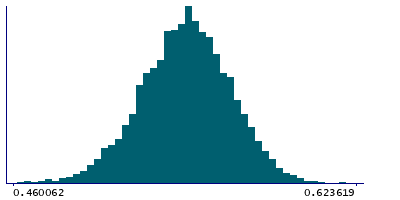
Instance 3 : First repeat imaging visit (2019+)
4,760 participants, 4,760 items
| Maximum | 0.730463 |
| Decile 9 | 0.5691 |
| Decile 8 | 0.559891 |
| Decile 7 | 0.553308 |
| Decile 6 | 0.547578 |
| Median | 0.542737 |
| Decile 4 | 0.537386 |
| Decile 3 | 0.531646 |
| Decile 2 | 0.524213 |
| Decile 1 | 0.514581 |
| Minimum | 0.356893 |
|
|
- Mean = 0.541883
- Std.dev = 0.0219952
- 11 items below graph minimum of 0.460062
- 1 item above graph maximum of 0.623619
|
Notes
Mean FA (fractional anisotropy) in middle cerebellar peduncle on FA skeleton (from dMRI data)
0 Related Data-Fields
There are no related data-fields

