Data
64,947 items of data are available, covering 60,419 participants.
Defined-instances run from 2 to 3, labelled using Instancing
2.
Units of measurement are AU.
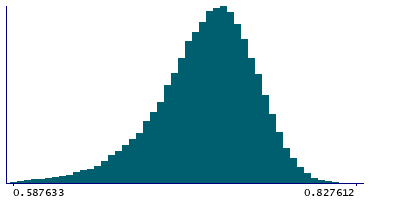
| Maximum | 0.827612 |
| Decile 9 | 0.76249 |
| Decile 8 | 0.75056 |
| Decile 7 | 0.741447 |
| Decile 6 | 0.733443 |
| Median | 0.725476 |
| Decile 4 | 0.716932 |
| Decile 3 | 0.707353 |
| Decile 2 | 0.69503 |
| Decile 1 | 0.675061 |
| Minimum | 0.22147 |
|
|
- Mean = 0.721264
- Std.dev = 0.0360403
- 230 items below graph minimum of 0.587633
|
2 Instances
Instance 2 : Imaging visit (2014+)
60,187 participants, 60,187 items
| Maximum | 0.827612 |
| Decile 9 | 0.762325 |
| Decile 8 | 0.750312 |
| Decile 7 | 0.741108 |
| Decile 6 | 0.733168 |
| Median | 0.725197 |
| Decile 4 | 0.716581 |
| Decile 3 | 0.706892 |
| Decile 2 | 0.694508 |
| Decile 1 | 0.67462 |
| Minimum | 0.22147 |
|

|
- Mean = 0.720931
- Std.dev = 0.0361248
- 215 items below graph minimum of 0.586914
|
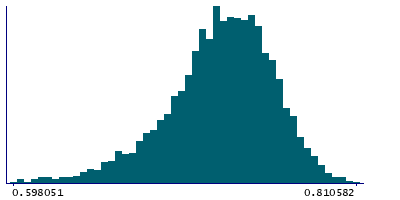
Instance 3 : First repeat imaging visit (2019+)
4,760 participants, 4,760 items
| Maximum | 0.810582 |
| Decile 9 | 0.764389 |
| Decile 8 | 0.75328 |
| Decile 7 | 0.744956 |
| Decile 6 | 0.737056 |
| Median | 0.729367 |
| Decile 4 | 0.721528 |
| Decile 3 | 0.712619 |
| Decile 2 | 0.700471 |
| Decile 1 | 0.68122 |
| Minimum | 0.42377 |
|
|
- Mean = 0.725477
- Std.dev = 0.0346797
- 16 items below graph minimum of 0.598051
|
Notes
Mean FA (fractional anisotropy) in genu of corpus callosum on FA skeleton (from dMRI data)
0 Related Data-Fields
There are no related data-fields

