Data
64,947 items of data are available, covering 60,419 participants.
Defined-instances run from 2 to 3, labelled using Instancing
2.
Units of measurement are AU.
| Maximum | 0.865228 |
| Decile 9 | 0.814785 |
| Decile 8 | 0.806656 |
| Decile 7 | 0.800588 |
| Decile 6 | 0.795297 |
| Median | 0.790135 |
| Decile 4 | 0.784812 |
| Decile 3 | 0.778992 |
| Decile 2 | 0.771837 |
| Decile 1 | 0.761095 |
| Minimum | 0.184025 |
|
|
- Mean = 0.788473
- Std.dev = 0.0227661
- 284 items below graph minimum of 0.707404
|
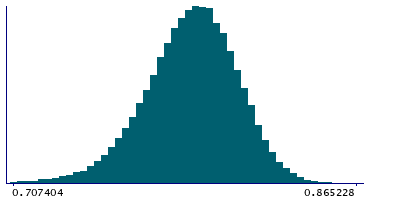
2 Instances
Instance 2 : Imaging visit (2014+)
60,187 participants, 60,187 items
| Maximum | 0.865228 |
| Decile 9 | 0.814742 |
| Decile 8 | 0.806653 |
| Decile 7 | 0.800589 |
| Decile 6 | 0.795289 |
| Median | 0.790123 |
| Decile 4 | 0.784736 |
| Decile 3 | 0.778878 |
| Decile 2 | 0.771696 |
| Decile 1 | 0.760941 |
| Minimum | 0.184025 |
|

|
- Mean = 0.788397
- Std.dev = 0.0228611
- 267 items below graph minimum of 0.707139
|
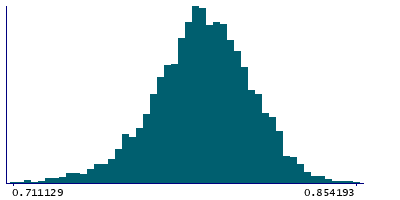
Instance 3 : First repeat imaging visit (2019+)
4,760 participants, 4,760 items
| Maximum | 0.854193 |
| Decile 9 | 0.815391 |
| Decile 8 | 0.806715 |
| Decile 7 | 0.800586 |
| Decile 6 | 0.795402 |
| Median | 0.790271 |
| Decile 4 | 0.785674 |
| Decile 3 | 0.780317 |
| Decile 2 | 0.77352 |
| Decile 1 | 0.76326 |
| Minimum | 0.566926 |
|
|
- Mean = 0.789442
- Std.dev = 0.0215052
- 14 items below graph minimum of 0.711129
|
Notes
Mean FA (fractional anisotropy) in splenium of corpus callosum on FA skeleton (from dMRI data)
0 Related Data-Fields
There are no related data-fields

