Data
64,947 items of data are available, covering 60,419 participants.
Defined-instances run from 2 to 3, labelled using Instancing
2.
Units of measurement are AU.
| Maximum | 0.72226 |
| Decile 9 | 0.511676 |
| Decile 8 | 0.501257 |
| Decile 7 | 0.493777 |
| Decile 6 | 0.487359 |
| Median | 0.481326 |
| Decile 4 | 0.475214 |
| Decile 3 | 0.468321 |
| Decile 2 | 0.460253 |
| Decile 1 | 0.448044 |
| Minimum | 0.173873 |
|
|
- Mean = 0.480134
- Std.dev = 0.0262232
- 225 items below graph minimum of 0.384411
- 10 items above graph maximum of 0.575309
|
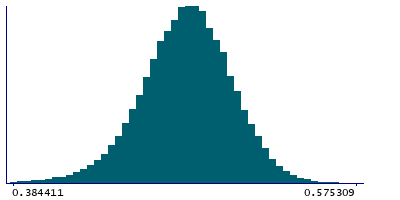
2 Instances
Instance 2 : Imaging visit (2014+)
60,187 participants, 60,187 items
| Maximum | 0.687514 |
| Decile 9 | 0.511593 |
| Decile 8 | 0.501151 |
| Decile 7 | 0.493645 |
| Decile 6 | 0.487226 |
| Median | 0.481197 |
| Decile 4 | 0.475047 |
| Decile 3 | 0.468093 |
| Decile 2 | 0.460041 |
| Decile 1 | 0.447822 |
| Minimum | 0.173873 |
|

|
- Mean = 0.479977
- Std.dev = 0.0262777
- 215 items below graph minimum of 0.384051
- 9 items above graph maximum of 0.575364
|
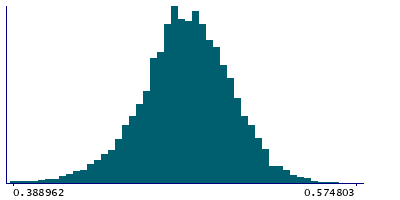
Instance 3 : First repeat imaging visit (2019+)
4,760 participants, 4,760 items
| Maximum | 0.72226 |
| Decile 9 | 0.512856 |
| Decile 8 | 0.502309 |
| Decile 7 | 0.49518 |
| Decile 6 | 0.488888 |
| Median | 0.482965 |
| Decile 4 | 0.476917 |
| Decile 3 | 0.471069 |
| Decile 2 | 0.463315 |
| Decile 1 | 0.450909 |
| Minimum | 0.332375 |
|
|
- Mean = 0.482126
- Std.dev = 0.0254396
- 12 items below graph minimum of 0.388962
- 1 item above graph maximum of 0.574803
|
Notes
Mean FA (fractional anisotropy) in posterior corona radiata (left) on FA skeleton (from dMRI data)
0 Related Data-Fields
There are no related data-fields

