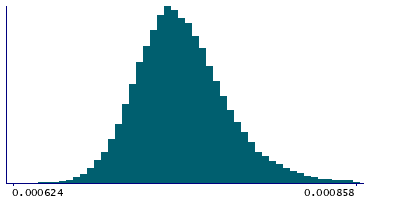
Data
83,911 items of data are available, covering 79,384 participants.
Defined-instances run from 2 to 3, labelled using Instancing
2.
Units of measurement are AU.
| Maximum | 0.001697 |
| Decile 9 | 0.000783 |
| Decile 8 | 0.000765 |
| Decile 7 | 0.000754 |
| Decile 6 | 0.000745 |
| Median | 0.000737 |
| Decile 4 | 0.00073 |
| Decile 3 | 0.000723 |
| Decile 2 | 0.000714 |
| Decile 1 | 0.000702 |
| Minimum | 0.000249 |
|
|
- Mean = 0.000740958
- Std.dev = 3.5137e-05
- 20 items below graph minimum of 0.000621
- 467 items above graph maximum of 0.000864
|
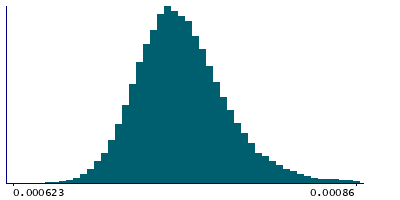
2 Instances
Instance 2 : Imaging visit (2014+)
79,153 participants, 79,153 items
| Maximum | 0.001697 |
| Decile 9 | 0.000783 |
| Decile 8 | 0.000766 |
| Decile 7 | 0.000754 |
| Decile 6 | 0.000745 |
| Median | 0.000738 |
| Decile 4 | 0.00073 |
| Decile 3 | 0.000723 |
| Decile 2 | 0.000714 |
| Decile 1 | 0.000703 |
| Minimum | 0.000249 |
|
|
- Mean = 0.000741306
- Std.dev = 3.53111e-05
- 17 items below graph minimum of 0.000623
- 463 items above graph maximum of 0.000863
|
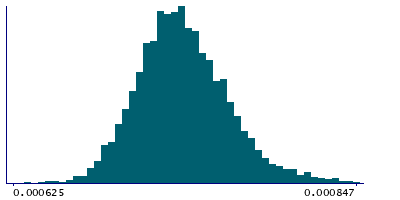
Instance 3 : First repeat imaging visit (2019+)
4,758 participants, 4,758 items
| Maximum | 0.001089 |
| Decile 9 | 0.000773 |
| Decile 8 | 0.000759 |
| Decile 7 | 0.000748 |
| Decile 6 | 0.00074 |
| Median | 0.000733 |
| Decile 4 | 0.000726 |
| Decile 3 | 0.000719 |
| Decile 2 | 0.00071 |
| Decile 1 | 0.000699 |
| Minimum | 0.000538 |
|
|
- Mean = 0.000735165
- Std.dev = 3.15446e-05
- 3 items below graph minimum of 0.000625
- 17 items above graph maximum of 0.000847
|
Notes
Mean MD (mean diffusivity) in splenium of corpus callosum on FA (fractional anisotropy) skeleton (from dMRI data)
0 Related Data-Fields
There are no related data-fields

