Data
83,911 items of data are available, covering 79,384 participants.
Defined-instances run from 2 to 3, labelled using Instancing
2.
Units of measurement are AU.
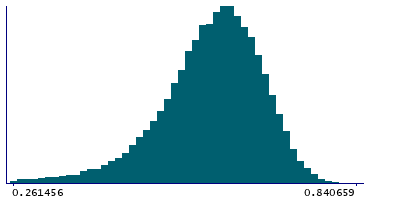
| Maximum | 0.850758 |
| Decile 9 | 0.690783 |
| Decile 8 | 0.66167 |
| Decile 7 | 0.639033 |
| Decile 6 | 0.618783 |
| Median | 0.59871 |
| Decile 4 | 0.577288 |
| Decile 3 | 0.553103 |
| Decile 2 | 0.522075 |
| Decile 1 | 0.471344 |
| Minimum | -0.220588 |
|
|
- Mean = 0.585716
- Std.dev = 0.09605
- 799 items below graph minimum of 0.251906
|
2 Instances
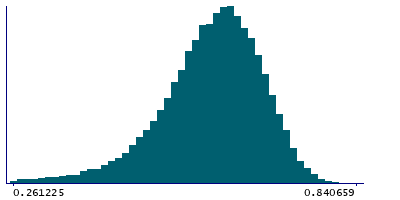
Instance 2 : Imaging visit (2014+)
79,153 participants, 79,153 items
| Maximum | 0.850758 |
| Decile 9 | 0.690625 |
| Decile 8 | 0.661439 |
| Decile 7 | 0.638709 |
| Decile 6 | 0.618463 |
| Median | 0.59826 |
| Decile 4 | 0.576787 |
| Decile 3 | 0.552613 |
| Decile 2 | 0.521476 |
| Decile 1 | 0.470816 |
| Minimum | -0.220588 |
|
|
- Mean = 0.585332
- Std.dev = 0.0961692
- 747 items below graph minimum of 0.251007
|
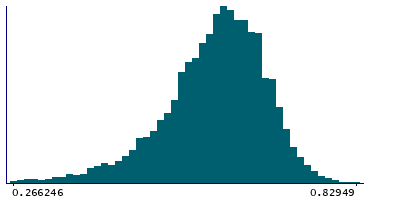
Instance 3 : First repeat imaging visit (2019+)
4,758 participants, 4,758 items
| Maximum | 0.82949 |
| Decile 9 | 0.692409 |
| Decile 8 | 0.664929 |
| Decile 7 | 0.644231 |
| Decile 6 | 0.624112 |
| Median | 0.605839 |
| Decile 4 | 0.585568 |
| Decile 3 | 0.561584 |
| Decile 2 | 0.532413 |
| Decile 1 | 0.479276 |
| Minimum | -0.156965 |
|
|
- Mean = 0.592107
- Std.dev = 0.0938138
- 48 items below graph minimum of 0.266144
|
Notes
Mean MO (diffusion tensor mode) in inferior cerebellar peduncle (right) on FA (fractional anisotropy) skeleton (from dMRI data)
0 Related Data-Fields
There are no related data-fields

