Data
64,947 items of data are available, covering 60,419 participants.
Defined-instances run from 2 to 3, labelled using Instancing
2.
Units of measurement are AU.
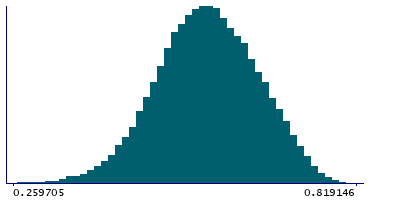
| Maximum | 0.819146 |
| Decile 9 | 0.682149 |
| Decile 8 | 0.647022 |
| Decile 7 | 0.620367 |
| Decile 6 | 0.597163 |
| Median | 0.575914 |
| Decile 4 | 0.554719 |
| Decile 3 | 0.532401 |
| Decile 2 | 0.506995 |
| Decile 1 | 0.470927 |
| Minimum | -0.000403 |
|
|
- Mean = 0.575318
- Std.dev = 0.0820193
- 38 items below graph minimum of 0.259705
|
2 Instances
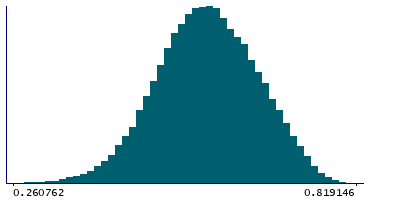
Instance 2 : Imaging visit (2014+)
60,187 participants, 60,187 items
| Maximum | 0.819146 |
| Decile 9 | 0.681939 |
| Decile 8 | 0.647003 |
| Decile 7 | 0.620365 |
| Decile 6 | 0.597134 |
| Median | 0.575987 |
| Decile 4 | 0.554865 |
| Decile 3 | 0.532657 |
| Decile 2 | 0.507286 |
| Decile 1 | 0.471351 |
| Minimum | -0.000403 |
|
|
- Mean = 0.57549
- Std.dev = 0.0817486
- 33 items below graph minimum of 0.260762
|
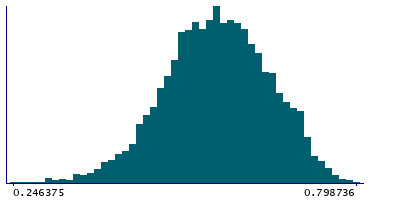
Instance 3 : First repeat imaging visit (2019+)
4,760 participants, 4,760 items
| Maximum | 0.798736 |
| Decile 9 | 0.683567 |
| Decile 8 | 0.647155 |
| Decile 7 | 0.620374 |
| Decile 6 | 0.597555 |
| Median | 0.574587 |
| Decile 4 | 0.552679 |
| Decile 3 | 0.528997 |
| Decile 2 | 0.503946 |
| Decile 1 | 0.464971 |
| Minimum | 0.081187 |
|
|
- Mean = 0.573147
- Std.dev = 0.0853383
- 3 items below graph minimum of 0.246375
|
Notes
Mean MO (diffusion tensor mode) in anterior corona radiata (left) on FA (fractional anisotropy) skeleton (from dMRI data)
0 Related Data-Fields
There are no related data-fields

