Data
64,947 items of data are available, covering 60,419 participants.
Defined-instances run from 2 to 3, labelled using Instancing
2.
Units of measurement are AU.
| Maximum | 0.866783 |
| Decile 9 | 0.729104 |
| Decile 8 | 0.701813 |
| Decile 7 | 0.679505 |
| Decile 6 | 0.65943 |
| Median | 0.639724 |
| Decile 4 | 0.61891 |
| Decile 3 | 0.595036 |
| Decile 2 | 0.565052 |
| Decile 1 | 0.520181 |
| Minimum | 0 |
|

|
- Mean = 0.630119
- Std.dev = 0.0849813
- 173 items below graph minimum of 0.311259
|
2 Instances
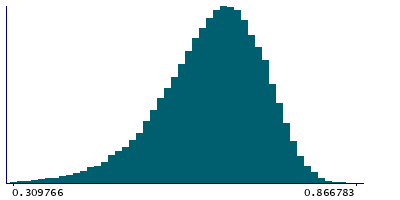
Instance 2 : Imaging visit (2014+)
60,187 participants, 60,187 items
| Maximum | 0.866783 |
| Decile 9 | 0.7288 |
| Decile 8 | 0.701199 |
| Decile 7 | 0.678936 |
| Decile 6 | 0.65894 |
| Median | 0.639091 |
| Decile 4 | 0.61822 |
| Decile 3 | 0.5942 |
| Decile 2 | 0.563946 |
| Decile 1 | 0.519283 |
| Minimum | 0 |
|
|
- Mean = 0.629377
- Std.dev = 0.0852344
- 159 items below graph minimum of 0.309766
|
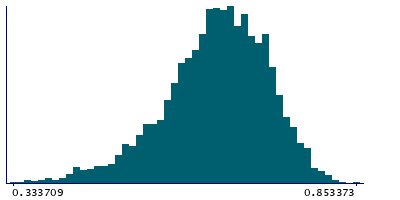
Instance 3 : First repeat imaging visit (2019+)
4,760 participants, 4,760 items
| Maximum | 0.853373 |
| Decile 9 | 0.732871 |
| Decile 8 | 0.708135 |
| Decile 7 | 0.686204 |
| Decile 6 | 0.665601 |
| Median | 0.647179 |
| Decile 4 | 0.629037 |
| Decile 3 | 0.606543 |
| Decile 2 | 0.579553 |
| Decile 1 | 0.53329 |
| Minimum | 0.001175 |
|
|
- Mean = 0.639504
- Std.dev = 0.0811299
- 12 items below graph minimum of 0.333709
|
Notes
Mean MO (diffusion tensor mode) in cingulum hippocampus (right) on FA (fractional anisotropy) skeleton (from dMRI data)
0 Related Data-Fields
There are no related data-fields

