Data
83,911 items of data are available, covering 79,384 participants.
Defined-instances run from 2 to 3, labelled using Instancing
2.
Units of measurement are AU.
| Maximum | 0.002314 |
| Decile 9 | 0.001277 |
| Decile 8 | 0.001218 |
| Decile 7 | 0.001181 |
| Decile 6 | 0.001151 |
| Median | 0.001126 |
| Decile 4 | 0.001104 |
| Decile 3 | 0.001081 |
| Decile 2 | 0.001058 |
| Decile 1 | 0.001028 |
| Minimum | 0 |
|

|
- Mean = 0.00114324
- Std.dev = 0.000106244
- 3 items below graph minimum of 0.000779
- 552 items above graph maximum of 0.001526
|
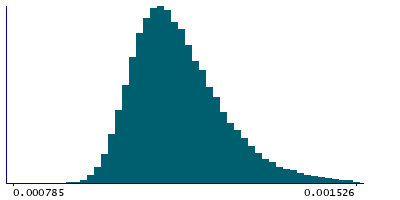
2 Instances
Instance 2 : Imaging visit (2014+)
79,153 participants, 79,153 items
| Maximum | 0.002314 |
| Decile 9 | 0.001277 |
| Decile 8 | 0.001218 |
| Decile 7 | 0.001181 |
| Decile 6 | 0.001152 |
| Median | 0.001127 |
| Decile 4 | 0.001104 |
| Decile 3 | 0.001082 |
| Decile 2 | 0.001058 |
| Decile 1 | 0.001028 |
| Minimum | 0 |
|
|
- Mean = 0.00114351
- Std.dev = 0.000106314
- 3 items below graph minimum of 0.000779
- 527 items above graph maximum of 0.001526
|
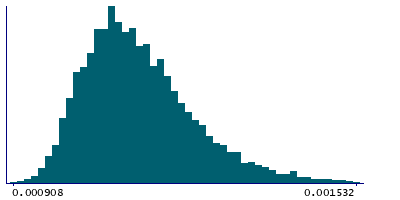
Instance 3 : First repeat imaging visit (2019+)
4,758 participants, 4,758 items
| Maximum | 0.001817 |
| Decile 9 | 0.001277 |
| Decile 8 | 0.001214 |
| Decile 7 | 0.001176 |
| Decile 6 | 0.001148 |
| Median | 0.001122 |
| Decile 4 | 0.001098 |
| Decile 3 | 0.001077 |
| Decile 2 | 0.001053 |
| Decile 1 | 0.001022 |
| Minimum | 0.000908 |
|
|
- Mean = 0.00113878
- Std.dev = 0.00010497
- 23 items above graph maximum of 0.001532
|
Notes
Mean L1 in pontine crossing tract on FA (fractional anisotropy) skeleton (from dMRI data)
0 Related Data-Fields
There are no related data-fields

