Data
64,942 items of data are available, covering 60,414 participants.
Defined-instances run from 2 to 3, labelled using Instancing
2.
Units of measurement are AU.
| Maximum | 0.99 |
| Decile 9 | 0.668643 |
| Decile 8 | 0.651869 |
| Decile 7 | 0.639596 |
| Decile 6 | 0.629064 |
| Median | 0.618879 |
| Decile 4 | 0.608484 |
| Decile 3 | 0.597148 |
| Decile 2 | 0.583283 |
| Decile 1 | 0.564091 |
| Minimum | 0.330716 |
|
|
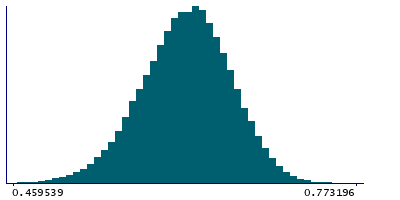
- Mean = 0.617357
- Std.dev = 0.0420718
- 47 items below graph minimum of 0.459539
- 43 items above graph maximum of 0.773196
|
2 Instances
Instance 2 : Imaging visit (2014+)
60,182 participants, 60,182 items
| Maximum | 0.99 |
| Decile 9 | 0.668508 |
| Decile 8 | 0.651732 |
| Decile 7 | 0.639444 |
| Decile 6 | 0.628911 |
| Median | 0.618712 |
| Decile 4 | 0.608236 |
| Decile 3 | 0.596868 |
| Decile 2 | 0.583014 |
| Decile 1 | 0.563777 |
| Minimum | 0.330716 |
|

|
- Mean = 0.617151
- Std.dev = 0.0421829
- 44 items below graph minimum of 0.459045
- 40 items above graph maximum of 0.77324
|
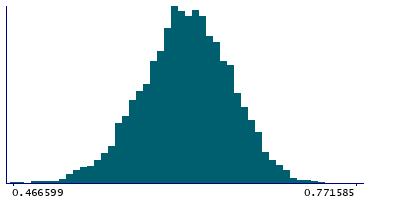
Instance 3 : First repeat imaging visit (2019+)
4,760 participants, 4,760 items
| Maximum | 0.987644 |
| Decile 9 | 0.669923 |
| Decile 8 | 0.654011 |
| Decile 7 | 0.641381 |
| Decile 6 | 0.630696 |
| Median | 0.620874 |
| Decile 4 | 0.611009 |
| Decile 3 | 0.600541 |
| Decile 2 | 0.587266 |
| Decile 1 | 0.568261 |
| Minimum | 0.45218 |
|
|
- Mean = 0.619965
- Std.dev = 0.0405503
- 2 items below graph minimum of 0.466599
- 3 items above graph maximum of 0.771585
|
Notes
Mean ICVF (intra-cellular volume fraction) in genu of corpus callosum on FA (fractional anisotropy) skeleton (from dMRI data)
0 Related Data-Fields
There are no related data-fields

