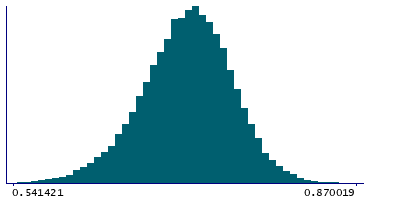
Data
83,906 items of data are available, covering 79,379 participants.
Defined-instances run from 2 to 3, labelled using Instancing
2.
Units of measurement are AU.
| Maximum | 0.99 |
| Decile 9 | 0.760666 |
| Decile 8 | 0.743419 |
| Decile 7 | 0.730827 |
| Decile 6 | 0.719602 |
| Median | 0.709141 |
| Decile 4 | 0.697969 |
| Decile 3 | 0.68604 |
| Decile 2 | 0.671474 |
| Decile 1 | 0.6499 |
| Minimum | 0 |
|
|
- Mean = 0.706947
- Std.dev = 0.0447142
- 74 items below graph minimum of 0.539135
- 39 items above graph maximum of 0.871432
|
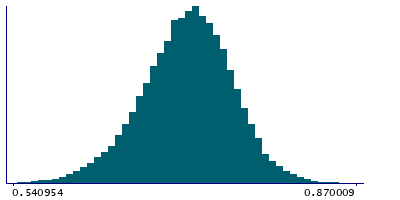
2 Instances
Instance 2 : Imaging visit (2014+)
79,148 participants, 79,148 items
| Maximum | 0.99 |
| Decile 9 | 0.760553 |
| Decile 8 | 0.743308 |
| Decile 7 | 0.730712 |
| Decile 6 | 0.719457 |
| Median | 0.708953 |
| Decile 4 | 0.697824 |
| Decile 3 | 0.685836 |
| Decile 2 | 0.671265 |
| Decile 1 | 0.649597 |
| Minimum | 0 |
|
|
- Mean = 0.70678
- Std.dev = 0.0447726
- 70 items below graph minimum of 0.53864
- 36 items above graph maximum of 0.87151
|
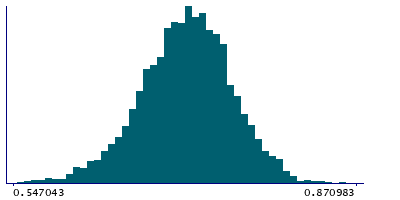
Instance 3 : First repeat imaging visit (2019+)
4,758 participants, 4,758 items
| Maximum | 0.934085 |
| Decile 9 | 0.762885 |
| Decile 8 | 0.744805 |
| Decile 7 | 0.733292 |
| Decile 6 | 0.722076 |
| Median | 0.711502 |
| Decile 4 | 0.700771 |
| Decile 3 | 0.689362 |
| Decile 2 | 0.674795 |
| Decile 1 | 0.654984 |
| Minimum | 0.524666 |
|
|
- Mean = 0.70973
- Std.dev = 0.0436363
- 6 items below graph minimum of 0.547083
- 3 items above graph maximum of 0.870787
|
Notes
Mean ICVF (intra-cellular volume fraction) in corticospinal tract (left) on FA (fractional anisotropy) skeleton (from dMRI data)
0 Related Data-Fields
There are no related data-fields

