Data
64,942 items of data are available, covering 60,414 participants.
Defined-instances run from 2 to 3, labelled using Instancing
2.
Units of measurement are AU.
| Maximum | 0.99 |
| Decile 9 | 0.706954 |
| Decile 8 | 0.694281 |
| Decile 7 | 0.684972 |
| Decile 6 | 0.677122 |
| Median | 0.670051 |
| Decile 4 | 0.663121 |
| Decile 3 | 0.655558 |
| Decile 2 | 0.646666 |
| Decile 1 | 0.634438 |
| Minimum | 0 |
|

|
- Mean = 0.670607
- Std.dev = 0.0297418
- 31 items below graph minimum of 0.561923
- 60 items above graph maximum of 0.779469
|
2 Instances
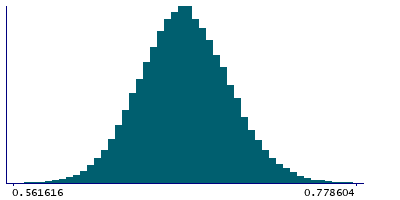
Instance 2 : Imaging visit (2014+)
60,182 participants, 60,182 items
| Maximum | 0.99 |
| Decile 9 | 0.706274 |
| Decile 8 | 0.693569 |
| Decile 7 | 0.684311 |
| Decile 6 | 0.676456 |
| Median | 0.669471 |
| Decile 4 | 0.662528 |
| Decile 3 | 0.655014 |
| Decile 2 | 0.64611 |
| Decile 1 | 0.633945 |
| Minimum | 0 |
|
|
- Mean = 0.669991
- Std.dev = 0.0297067
- 30 items below graph minimum of 0.561616
- 56 items above graph maximum of 0.778604
|
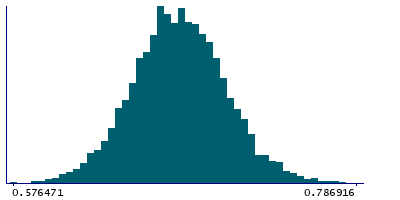
Instance 3 : First repeat imaging visit (2019+)
4,760 participants, 4,760 items
| Maximum | 0.919892 |
| Decile 9 | 0.714597 |
| Decile 8 | 0.701859 |
| Decile 7 | 0.692757 |
| Decile 6 | 0.685209 |
| Median | 0.677973 |
| Decile 4 | 0.670342 |
| Decile 3 | 0.663568 |
| Decile 2 | 0.654442 |
| Decile 1 | 0.642278 |
| Minimum | 0.576471 |
|
|
- Mean = 0.678401
- Std.dev = 0.0290758
- 5 items above graph maximum of 0.786916
|
Notes
Mean ICVF (intra-cellular volume fraction) in inferior cerebellar peduncle (left) on FA (fractional anisotropy) skeleton (from dMRI data)
0 Related Data-Fields
There are no related data-fields

