Data
64,942 items of data are available, covering 60,414 participants.
Defined-instances run from 2 to 3, labelled using Instancing
2.
Units of measurement are AU.
| Maximum | 0.99 |
| Decile 9 | 0.561651 |
| Decile 8 | 0.536704 |
| Decile 7 | 0.518015 |
| Decile 6 | 0.50157 |
| Median | 0.485584 |
| Decile 4 | 0.468921 |
| Decile 3 | 0.450066 |
| Decile 2 | 0.426653 |
| Decile 1 | 0.390212 |
| Minimum | 0 |
|

|
- Mean = 0.479997
- Std.dev = 0.0698682
- 73 items below graph minimum of 0.218774
- 32 items above graph maximum of 0.733089
|
2 Instances
Instance 2 : Imaging visit (2014+)
60,182 participants, 60,182 items
| Maximum | 0.99 |
| Decile 9 | 0.56185 |
| Decile 8 | 0.536941 |
| Decile 7 | 0.518088 |
| Decile 6 | 0.501606 |
| Median | 0.485545 |
| Decile 4 | 0.468876 |
| Decile 3 | 0.449885 |
| Decile 2 | 0.426293 |
| Decile 1 | 0.389977 |
| Minimum | 0 |
|

|
- Mean = 0.479975
- Std.dev = 0.0699935
- 68 items below graph minimum of 0.218105
- 30 items above graph maximum of 0.733722
|
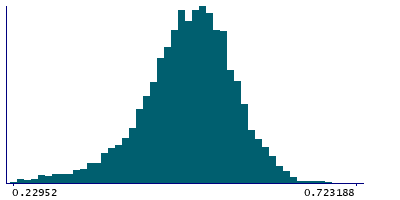
Instance 3 : First repeat imaging visit (2019+)
4,760 participants, 4,760 items
| Maximum | 0.97041 |
| Decile 9 | 0.558632 |
| Decile 8 | 0.533927 |
| Decile 7 | 0.516896 |
| Decile 6 | 0.501205 |
| Median | 0.486221 |
| Decile 4 | 0.469965 |
| Decile 3 | 0.452133 |
| Decile 2 | 0.430005 |
| Decile 1 | 0.394076 |
| Minimum | 0.19355 |
|
|
- Mean = 0.480273
- Std.dev = 0.0682637
- 6 items below graph minimum of 0.22952
- 2 items above graph maximum of 0.723188
|
Notes
Mean ICVF (intra-cellular volume fraction) in tapetum (right) on FA (fractional anisotropy) skeleton (from dMRI data)
0 Related Data-Fields
There are no related data-fields

