Data
83,906 items of data are available, covering 79,379 participants.
Defined-instances run from 2 to 3, labelled using Instancing
2.
Units of measurement are AU.
| Maximum | 0.61159 |
| Decile 9 | 0.126042 |
| Decile 8 | 0.118417 |
| Decile 7 | 0.113533 |
| Decile 6 | 0.109675 |
| Median | 0.106235 |
| Decile 4 | 0.102878 |
| Decile 3 | 0.099452 |
| Decile 2 | 0.095655 |
| Decile 1 | 0.0906115 |
| Minimum | 0 |
|
|
- Mean = 0.107806
- Std.dev = 0.0165552
- 4 items below graph minimum of 0.055181
- 422 items above graph maximum of 0.161472
|
2 Instances
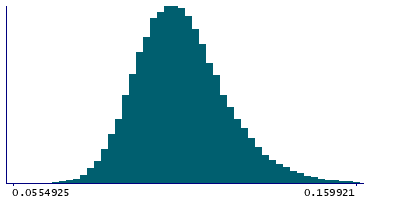
Instance 2 : Imaging visit (2014+)
79,148 participants, 79,148 items
| Maximum | 0.573136 |
| Decile 9 | 0.126202 |
| Decile 8 | 0.118573 |
| Decile 7 | 0.113661 |
| Decile 6 | 0.109776 |
| Median | 0.106311 |
| Decile 4 | 0.102956 |
| Decile 3 | 0.0995325 |
| Decile 2 | 0.095735 |
| Decile 1 | 0.0906905 |
| Minimum | 0 |
|

|
- Mean = 0.107903
- Std.dev = 0.0165036
- 3 items below graph minimum of 0.0551785
- 398 items above graph maximum of 0.161714
|
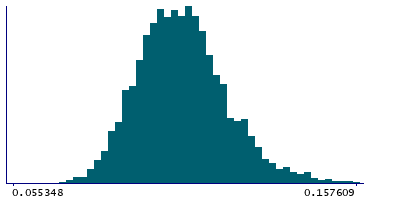
Instance 3 : First repeat imaging visit (2019+)
4,758 participants, 4,758 items
| Maximum | 0.61159 |
| Decile 9 | 0.123528 |
| Decile 8 | 0.116158 |
| Decile 7 | 0.111661 |
| Decile 6 | 0.108268 |
| Median | 0.104859 |
| Decile 4 | 0.101399 |
| Decile 3 | 0.098184 |
| Decile 2 | 0.09451 |
| Decile 1 | 0.0894325 |
| Minimum | 0.052178 |
|
|
- Mean = 0.1062
- Std.dev = 0.0173134
- 1 item below graph minimum of 0.0553375
- 24 items above graph maximum of 0.157623
|
Notes
Mean OD (orientation dispersion index) in medial lemniscus (left) on FA (fractional anisotropy) skeleton (from dMRI data)
0 Related Data-Fields
There are no related data-fields

