Data
83,906 items of data are available, covering 79,379 participants.
Defined-instances run from 2 to 3, labelled using Instancing
2.
Units of measurement are AU.
| Maximum | 0.604521 |
| Decile 9 | 0.196993 |
| Decile 8 | 0.189021 |
| Decile 7 | 0.183382 |
| Decile 6 | 0.178717 |
| Median | 0.174289 |
| Decile 4 | 0.169996 |
| Decile 3 | 0.165413 |
| Decile 2 | 0.159932 |
| Decile 1 | 0.152639 |
| Minimum | 0.083604 |
|

|
- Mean = 0.174724
- Std.dev = 0.0181037
- 1 item below graph minimum of 0.108286
- 60 items above graph maximum of 0.241346
|
2 Instances
Instance 2 : Imaging visit (2014+)
79,148 participants, 79,148 items
| Maximum | 0.604521 |
| Decile 9 | 0.197024 |
| Decile 8 | 0.189044 |
| Decile 7 | 0.183394 |
| Decile 6 | 0.17873 |
| Median | 0.174299 |
| Decile 4 | 0.16999 |
| Decile 3 | 0.165395 |
| Decile 2 | 0.15993 |
| Decile 1 | 0.152642 |
| Minimum | 0.083604 |
|

|
- Mean = 0.174725
- Std.dev = 0.0180701
- 1 item below graph minimum of 0.10826
- 56 items above graph maximum of 0.241407
|
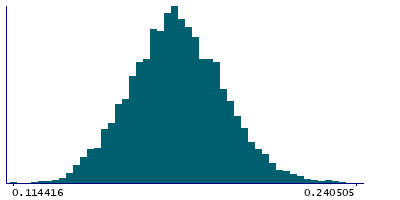
Instance 3 : First repeat imaging visit (2019+)
4,758 participants, 4,758 items
| Maximum | 0.538583 |
| Decile 9 | 0.196557 |
| Decile 8 | 0.188789 |
| Decile 7 | 0.183044 |
| Decile 6 | 0.178472 |
| Median | 0.174055 |
| Decile 4 | 0.170071 |
| Decile 3 | 0.165603 |
| Decile 2 | 0.159971 |
| Decile 1 | 0.152589 |
| Minimum | 0.114416 |
|
|
- Mean = 0.174696
- Std.dev = 0.0186535
- 3 items above graph maximum of 0.240526
|
Notes
Mean OD (orientation dispersion index) in anterior corona radiata (right) on FA (fractional anisotropy) skeleton (from dMRI data)
0 Related Data-Fields
There are no related data-fields

