Data
64,942 items of data are available, covering 60,414 participants.
Defined-instances run from 2 to 3, labelled using Instancing
2.
Units of measurement are AU.
| Maximum | 0.567309 |
| Decile 9 | 0.175839 |
| Decile 8 | 0.164453 |
| Decile 7 | 0.156784 |
| Decile 6 | 0.150294 |
| Median | 0.144349 |
| Decile 4 | 0.138694 |
| Decile 3 | 0.132788 |
| Decile 2 | 0.126181 |
| Decile 1 | 0.117376 |
| Minimum | 0 |
|

|
- Mean = 0.145839
- Std.dev = 0.0236322
- 3 items below graph minimum of 0.0589135
- 77 items above graph maximum of 0.234301
|
2 Instances
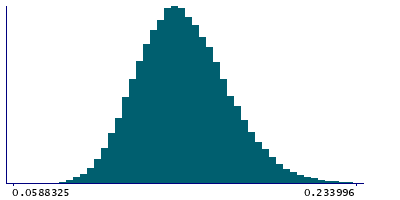
Instance 2 : Imaging visit (2014+)
60,182 participants, 60,182 items
| Maximum | 0.567309 |
| Decile 9 | 0.175609 |
| Decile 8 | 0.164328 |
| Decile 7 | 0.156645 |
| Decile 6 | 0.150097 |
| Median | 0.144183 |
| Decile 4 | 0.138574 |
| Decile 3 | 0.132661 |
| Decile 2 | 0.126041 |
| Decile 1 | 0.117221 |
| Minimum | 0 |
|
|
- Mean = 0.145687
- Std.dev = 0.023622
- 3 items below graph minimum of 0.0588325
- 71 items above graph maximum of 0.233996
|
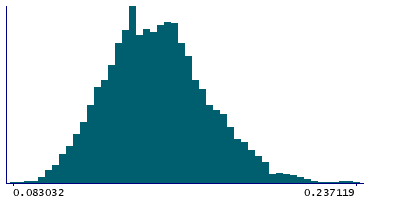
Instance 3 : First repeat imaging visit (2019+)
4,760 participants, 4,760 items
| Maximum | 0.456236 |
| Decile 9 | 0.178154 |
| Decile 8 | 0.166259 |
| Decile 7 | 0.15828 |
| Decile 6 | 0.152533 |
| Median | 0.146458 |
| Decile 4 | 0.140319 |
| Decile 3 | 0.134783 |
| Decile 2 | 0.128225 |
| Decile 1 | 0.119189 |
| Minimum | 0.083032 |
|
|
- Mean = 0.147773
- Std.dev = 0.0236753
- 3 items above graph maximum of 0.237119
|
Notes
Mean OD (orientation dispersion index) in uncinate fasciculus (left) on FA (fractional anisotropy) skeleton (from dMRI data)
0 Related Data-Fields
There are no related data-fields

