Data
83,909 items of data are available, covering 79,382 participants.
Defined-instances run from 2 to 3, labelled using Instancing
2.
Units of measurement are AU.
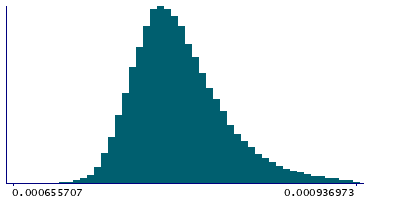
| Maximum | 0.00124132 |
| Decile 9 | 0.000848249 |
| Decile 8 | 0.000824317 |
| Decile 7 | 0.000809617 |
| Decile 6 | 0.000798476 |
| Median | 0.000789137 |
| Decile 4 | 0.000780636 |
| Decile 3 | 0.000772115 |
| Decile 2 | 0.000762929 |
| Decile 1 | 0.000751073 |
| Minimum | 0 |
|
|
- Mean = 0.000795445
- Std.dev = 4.31598e-05
- 26 items below graph minimum of 0.000653898
- 473 items above graph maximum of 0.000945424
|
2 Instances
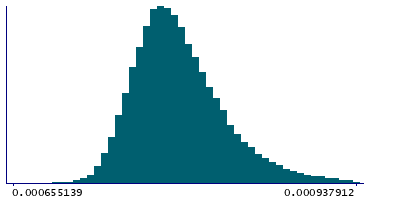
Instance 2 : Imaging visit (2014+)
79,151 participants, 79,151 items
| Maximum | 0.00124132 |
| Decile 9 | 0.000848944 |
| Decile 8 | 0.000824881 |
| Decile 7 | 0.000810078 |
| Decile 6 | 0.000798838 |
| Median | 0.000789416 |
| Decile 4 | 0.000780877 |
| Decile 3 | 0.00077232 |
| Decile 2 | 0.000763046 |
| Decile 1 | 0.000751107 |
| Minimum | 0 |
|
|
- Mean = 0.000795785
- Std.dev = 4.32297e-05
- 23 items below graph minimum of 0.00065327
- 436 items above graph maximum of 0.000946781
|
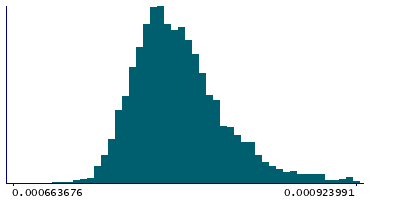
Instance 3 : First repeat imaging visit (2019+)
4,758 participants, 4,758 items
| Maximum | 0.0010538 |
| Decile 9 | 0.000837223 |
| Decile 8 | 0.000815421 |
| Decile 7 | 0.000802554 |
| Decile 6 | 0.000793152 |
| Median | 0.000784872 |
| Decile 4 | 0.000776509 |
| Decile 3 | 0.000769287 |
| Decile 2 | 0.000761115 |
| Decile 1 | 0.000750454 |
| Minimum | 0 |
|
|
- Mean = 0.000789801
- Std.dev = 4.15759e-05
- 3 items below graph minimum of 0.000663686
- 26 items above graph maximum of 0.000923991
|
Notes
Weighted-mean MD (mean diffusivity) in tract right anterior thalamic radiation (from dMRI data)
0 Related Data-Fields
There are no related data-fields

