Data
83,909 items of data are available, covering 79,382 participants.
Defined-instances run from 2 to 3, labelled using Instancing
2.
Units of measurement are AU.
| Maximum | 0.00124961 |
| Decile 9 | 0.000876997 |
| Decile 8 | 0.000857614 |
| Decile 7 | 0.000845317 |
| Decile 6 | 0.000835489 |
| Median | 0.000826653 |
| Decile 4 | 0.000818254 |
| Decile 3 | 0.000809617 |
| Decile 2 | 0.000800037 |
| Decile 1 | 0.00078727 |
| Minimum | 0 |
|

|
- Mean = 0.000830113
- Std.dev = 3.83449e-05
- 13 items below graph minimum of 0.000697544
- 323 items above graph maximum of 0.000966723
|
2 Instances
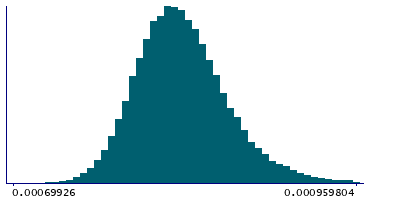
Instance 2 : Imaging visit (2014+)
79,151 participants, 79,151 items
| Maximum | 0.00124961 |
| Decile 9 | 0.000877832 |
| Decile 8 | 0.000858361 |
| Decile 7 | 0.000846041 |
| Decile 6 | 0.000836222 |
| Median | 0.000827328 |
| Decile 4 | 0.000818956 |
| Decile 3 | 0.000810262 |
| Decile 2 | 0.000800629 |
| Decile 1 | 0.000787906 |
| Minimum | 0 |
|
|
- Mean = 0.000830834
- Std.dev = 3.83839e-05
- 13 items below graph minimum of 0.00069798
- 306 items above graph maximum of 0.000967757
|
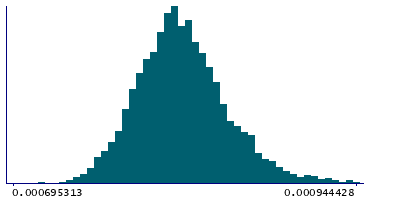
Instance 3 : First repeat imaging visit (2019+)
4,758 participants, 4,758 items
| Maximum | 0.000999195 |
| Decile 9 | 0.000861422 |
| Decile 8 | 0.00084308 |
| Decile 7 | 0.000832286 |
| Decile 6 | 0.000823244 |
| Median | 0.000815422 |
| Decile 4 | 0.000808428 |
| Decile 3 | 0.000800508 |
| Decile 2 | 0.000790835 |
| Decile 1 | 0.000778347 |
| Minimum | 0 |
|
|
- Mean = 0.000818114
- Std.dev = 3.56075e-05
- 1 item below graph minimum of 0.000695273
- 14 items above graph maximum of 0.000944497
|
Notes
Weighted-mean MD (mean diffusivity) in tract right inferior longitudinal fasciculus (from dMRI data)
0 Related Data-Fields
There are no related data-fields

