Data
64,945 items of data are available, covering 60,417 participants.
Defined-instances run from 2 to 3, labelled using Instancing
2.
Units of measurement are AU.
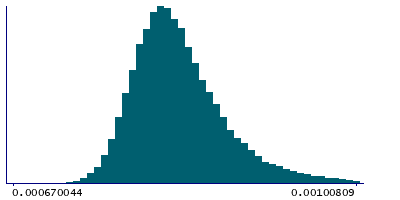
| Maximum | 0.00144379 |
| Decile 9 | 0.000895409 |
| Decile 8 | 0.000867016 |
| Decile 7 | 0.000849854 |
| Decile 6 | 0.000837315 |
| Median | 0.000826736 |
| Decile 4 | 0.000817029 |
| Decile 3 | 0.000807363 |
| Decile 2 | 0.000796553 |
| Decile 1 | 0.000782727 |
| Minimum | 0 |
|
|
- Mean = 0.000834515
- Std.dev = 5.13913e-05
- 21 items below graph minimum of 0.000670044
- 519 items above graph maximum of 0.00100809
|
2 Instances
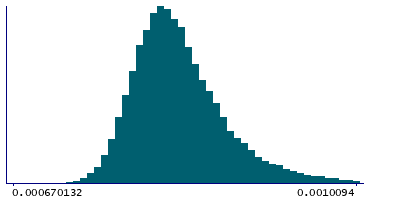
Instance 2 : Imaging visit (2014+)
60,185 participants, 60,185 items
| Maximum | 0.00144379 |
| Decile 9 | 0.000896312 |
| Decile 8 | 0.000867796 |
| Decile 7 | 0.000850755 |
| Decile 6 | 0.000838083 |
| Median | 0.000827598 |
| Decile 4 | 0.000817743 |
| Decile 3 | 0.000808084 |
| Decile 2 | 0.000797253 |
| Decile 1 | 0.000783222 |
| Minimum | 0 |
|
|
- Mean = 0.000835291
- Std.dev = 5.15056e-05
- 19 items below graph minimum of 0.000670132
- 475 items above graph maximum of 0.0010094
|
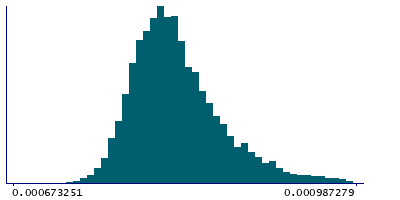
Instance 3 : First repeat imaging visit (2019+)
4,760 participants, 4,760 items
| Maximum | 0.00119184 |
| Decile 9 | 0.000882603 |
| Decile 8 | 0.000854465 |
| Decile 7 | 0.000838279 |
| Decile 6 | 0.000826071 |
| Median | 0.000816999 |
| Decile 4 | 0.000808324 |
| Decile 3 | 0.0007993 |
| Decile 2 | 0.000789621 |
| Decile 1 | 0.000777927 |
| Minimum | 0 |
|
|
- Mean = 0.000824701
- Std.dev = 4.88724e-05
- 2 items below graph minimum of 0.000673251
- 46 items above graph maximum of 0.000987279
|
Notes
Weighted-mean MD (mean diffusivity) in tract left posterior thalamic radiation (from dMRI data)
0 Related Data-Fields
There are no related data-fields

