Data
64,945 items of data are available, covering 60,417 participants.
Defined-instances run from 2 to 3, labelled using Instancing
2.
Units of measurement are AU.
| Maximum | 0.65278 |
| Decile 9 | 0.422693 |
| Decile 8 | 0.395129 |
| Decile 7 | 0.375271 |
| Decile 6 | 0.358492 |
| Median | 0.34267 |
| Decile 4 | 0.327085 |
| Decile 3 | 0.310595 |
| Decile 2 | 0.291346 |
| Decile 1 | 0.263443 |
| Minimum | -0.0158802 |
|

|
- Mean = 0.342905
- Std.dev = 0.063222
- 1 item below graph minimum of 0
- 10 items above graph maximum of 0.581942
|
2 Instances
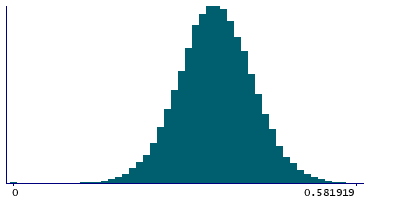
Instance 2 : Imaging visit (2014+)
60,185 participants, 60,185 items
| Maximum | 0.65278 |
| Decile 9 | 0.422777 |
| Decile 8 | 0.395323 |
| Decile 7 | 0.37545 |
| Decile 6 | 0.35856 |
| Median | 0.342802 |
| Decile 4 | 0.32721 |
| Decile 3 | 0.310633 |
| Decile 2 | 0.291488 |
| Decile 1 | 0.263635 |
| Minimum | -0.0158802 |
|
|
- Mean = 0.343076
- Std.dev = 0.063234
- 1 item below graph minimum of 0
- 9 items above graph maximum of 0.581919
|
Instance 3 : First repeat imaging visit (2019+)
4,760 participants, 4,760 items
| Maximum | 0.586199 |
| Decile 9 | 0.420724 |
| Decile 8 | 0.392205 |
| Decile 7 | 0.373168 |
| Decile 6 | 0.357773 |
| Median | 0.340737 |
| Decile 4 | 0.326025 |
| Decile 3 | 0.31012 |
| Decile 2 | 0.289198 |
| Decile 1 | 0.260734 |
| Minimum | 0 |
|

|
- Mean = 0.340752
- Std.dev = 0.0630299
- 1 item above graph maximum of 0.580714
|
Notes
Weighted-mean MO (diffusion tensor mode) in tract right acoustic radiation (from dMRI data)
0 Related Data-Fields
There are no related data-fields

