Data
64,945 items of data are available, covering 60,417 participants.
Defined-instances run from 2 to 3, labelled using Instancing
2.
Units of measurement are AU.
| Maximum | 0.00159249 |
| Decile 9 | 0.00119543 |
| Decile 8 | 0.00117166 |
| Decile 7 | 0.0011563 |
| Decile 6 | 0.00114415 |
| Median | 0.00113379 |
| Decile 4 | 0.00112427 |
| Decile 3 | 0.00111462 |
| Decile 2 | 0.00110384 |
| Decile 1 | 0.00108959 |
| Minimum | 0 |
|

|
- Mean = 0.00113883
- Std.dev = 4.88853e-05
- 32 items below graph minimum of 0.000983741
- 221 items above graph maximum of 0.00130127
|
2 Instances
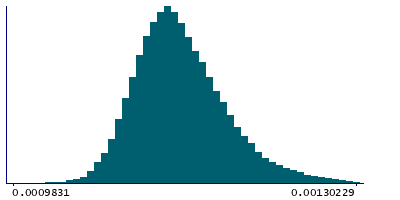
Instance 2 : Imaging visit (2014+)
60,185 participants, 60,185 items
| Maximum | 0.00159249 |
| Decile 9 | 0.0011959 |
| Decile 8 | 0.00117212 |
| Decile 7 | 0.00115675 |
| Decile 6 | 0.00114447 |
| Median | 0.00113406 |
| Decile 4 | 0.00112455 |
| Decile 3 | 0.00111481 |
| Decile 2 | 0.00110391 |
| Decile 1 | 0.0010895 |
| Minimum | 0 |
|
|
- Mean = 0.00113913
- Std.dev = 4.88258e-05
- 29 items below graph minimum of 0.0009831
- 203 items above graph maximum of 0.00130229
|
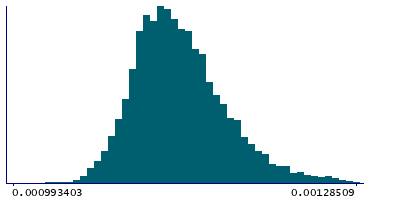
Instance 3 : First repeat imaging visit (2019+)
4,760 participants, 4,760 items
| Maximum | 0.00141822 |
| Decile 9 | 0.00118786 |
| Decile 8 | 0.00116605 |
| Decile 7 | 0.0011514 |
| Decile 6 | 0.00114043 |
| Median | 0.00113044 |
| Decile 4 | 0.00112126 |
| Decile 3 | 0.00111221 |
| Decile 2 | 0.00110294 |
| Decile 1 | 0.00109063 |
| Minimum | 0 |
|
|
- Mean = 0.00113511
- Std.dev = 4.94808e-05
- 3 items below graph minimum of 0.000993403
- 20 items above graph maximum of 0.00128509
|
Notes
Weighted-mean L1 in tract right anterior thalamic radiation (from dMRI data)
0 Related Data-Fields
There are no related data-fields

