Data
64,945 items of data are available, covering 60,417 participants.
Defined-instances run from 2 to 3, labelled using Instancing
2.
Units of measurement are AU.
| Maximum | 0.00155526 |
| Decile 9 | 0.00130472 |
| Decile 8 | 0.00128245 |
| Decile 7 | 0.00126666 |
| Decile 6 | 0.00125304 |
| Median | 0.00124037 |
| Decile 4 | 0.00122746 |
| Decile 3 | 0.0012137 |
| Decile 2 | 0.00119745 |
| Decile 1 | 0.00117488 |
| Minimum | 0 |
|

|
- Mean = 0.00123962
- Std.dev = 5.70188e-05
- 48 items below graph minimum of 0.00104503
- 8 items above graph maximum of 0.00143456
|
2 Instances
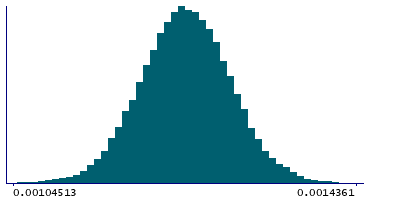
Instance 2 : Imaging visit (2014+)
60,185 participants, 60,185 items
| Maximum | 0.00155526 |
| Decile 9 | 0.00130486 |
| Decile 8 | 0.00128253 |
| Decile 7 | 0.00126664 |
| Decile 6 | 0.0012529 |
| Median | 0.00124018 |
| Decile 4 | 0.00122733 |
| Decile 3 | 0.00121351 |
| Decile 2 | 0.00119708 |
| Decile 1 | 0.00117438 |
| Minimum | 0 |
|
|
- Mean = 0.00123949
- Std.dev = 5.70151e-05
- 45 items below graph minimum of 0.00104389
- 8 items above graph maximum of 0.00143534
|
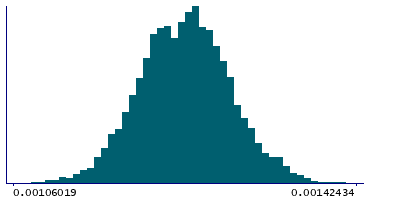
Instance 3 : First repeat imaging visit (2019+)
4,760 participants, 4,760 items
| Maximum | 0.00142469 |
| Decile 9 | 0.00130295 |
| Decile 8 | 0.00128164 |
| Decile 7 | 0.00126699 |
| Decile 6 | 0.00125433 |
| Median | 0.00124262 |
| Decile 4 | 0.0012292 |
| Decile 3 | 0.00121586 |
| Decile 2 | 0.001202 |
| Decile 1 | 0.00118157 |
| Minimum | 0 |
|
|
- Mean = 0.00124123
- Std.dev = 5.70419e-05
- 3 items below graph minimum of 0.00106019
- 1 item above graph maximum of 0.00142434
|
Notes
Weighted-mean L1 in tract right cingulate gyrus part of cingulum (from dMRI data)
0 Related Data-Fields
There are no related data-fields

