Data
64,945 items of data are available, covering 60,417 participants.
Defined-instances run from 2 to 3, labelled using Instancing
2.
Units of measurement are AU.
| Maximum | 0.00156573 |
| Decile 9 | 0.00135976 |
| Decile 8 | 0.00134209 |
| Decile 7 | 0.00132965 |
| Decile 6 | 0.00131886 |
| Median | 0.00130888 |
| Decile 4 | 0.00129901 |
| Decile 3 | 0.00128862 |
| Decile 2 | 0.00127613 |
| Decile 1 | 0.00125847 |
| Minimum | 0 |
|
|
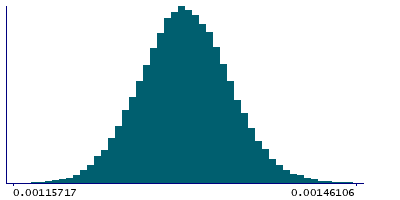
- Mean = 0.0013087
- Std.dev = 4.81785e-05
- 36 items below graph minimum of 0.00115717
- 23 items above graph maximum of 0.00146106
|
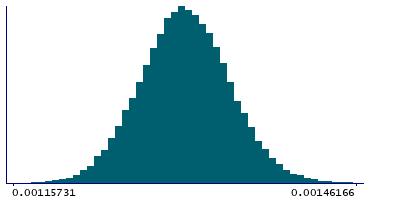
2 Instances
Instance 2 : Imaging visit (2014+)
60,185 participants, 60,185 items
| Maximum | 0.00156573 |
| Decile 9 | 0.00136021 |
| Decile 8 | 0.00134247 |
| Decile 7 | 0.00133005 |
| Decile 6 | 0.00131927 |
| Median | 0.00130924 |
| Decile 4 | 0.00129935 |
| Decile 3 | 0.001289 |
| Decile 2 | 0.00127646 |
| Decile 1 | 0.00125876 |
| Minimum | 0 |
|
|
- Mean = 0.0013091
- Std.dev = 4.79464e-05
- 34 items below graph minimum of 0.00115731
- 21 items above graph maximum of 0.00146166
|
Instance 3 : First repeat imaging visit (2019+)
4,760 participants, 4,760 items
| Maximum | 0.00148748 |
| Decile 9 | 0.00135336 |
| Decile 8 | 0.00133675 |
| Decile 7 | 0.00132484 |
| Decile 6 | 0.00131384 |
| Median | 0.00130414 |
| Decile 4 | 0.00129433 |
| Decile 3 | 0.00128458 |
| Decile 2 | 0.00127211 |
| Decile 1 | 0.00125513 |
| Minimum | 0 |
|

|
- Mean = 0.00130373
- Std.dev = 5.07597e-05
- 3 items below graph minimum of 0.00115691
- 1 item above graph maximum of 0.00145159
|
Notes
Weighted-mean L1 in tract left corticospinal tract (from dMRI data)
0 Related Data-Fields
There are no related data-fields

