Data
64,945 items of data are available, covering 60,417 participants.
Defined-instances run from 2 to 3, labelled using Instancing
2.
Units of measurement are AU.
| Maximum | 0.00171443 |
| Decile 9 | 0.00135564 |
| Decile 8 | 0.00133824 |
| Decile 7 | 0.00132597 |
| Decile 6 | 0.0013154 |
| Median | 0.00130527 |
| Decile 4 | 0.0012953 |
| Decile 3 | 0.00128467 |
| Decile 2 | 0.00127224 |
| Decile 1 | 0.0012547 |
| Minimum | 0 |
|

|
- Mean = 0.00130489
- Std.dev = 4.75719e-05
- 37 items below graph minimum of 0.00115377
- 32 items above graph maximum of 0.00145657
|
2 Instances
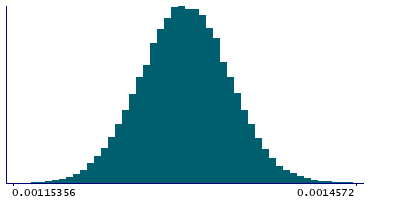
Instance 2 : Imaging visit (2014+)
60,185 participants, 60,185 items
| Maximum | 0.00171443 |
| Decile 9 | 0.00135599 |
| Decile 8 | 0.00133856 |
| Decile 7 | 0.00132624 |
| Decile 6 | 0.00131573 |
| Median | 0.00130554 |
| Decile 4 | 0.00129556 |
| Decile 3 | 0.00128496 |
| Decile 2 | 0.00127244 |
| Decile 1 | 0.00125478 |
| Minimum | 0 |
|
|
- Mean = 0.00130515
- Std.dev = 4.73386e-05
- 34 items below graph minimum of 0.00115356
- 27 items above graph maximum of 0.0014572
|
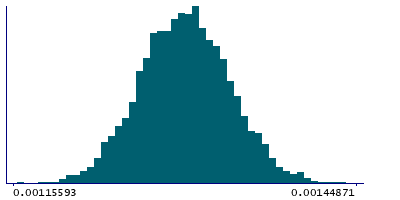
Instance 3 : First repeat imaging visit (2019+)
4,760 participants, 4,760 items
| Maximum | 0.00149881 |
| Decile 9 | 0.00135111 |
| Decile 8 | 0.0013344 |
| Decile 7 | 0.00132241 |
| Decile 6 | 0.00131193 |
| Median | 0.00130213 |
| Decile 4 | 0.00129212 |
| Decile 3 | 0.00128139 |
| Decile 2 | 0.00127027 |
| Decile 1 | 0.00125352 |
| Minimum | 0 |
|
|
- Mean = 0.00130157
- Std.dev = 5.03103e-05
- 3 items below graph minimum of 0.00115593
- 4 items above graph maximum of 0.00144871
|
Notes
Weighted-mean L1 in tract right corticospinal tract (from dMRI data)
0 Related Data-Fields
There are no related data-fields

