Data
83,909 items of data are available, covering 79,382 participants.
Defined-instances run from 2 to 3, labelled using Instancing
2.
Units of measurement are AU.
| Maximum | 0.00166898 |
| Decile 9 | 0.00135071 |
| Decile 8 | 0.00133289 |
| Decile 7 | 0.0013206 |
| Decile 6 | 0.00131031 |
| Median | 0.00130082 |
| Decile 4 | 0.00129164 |
| Decile 3 | 0.00128214 |
| Decile 2 | 0.00127085 |
| Decile 1 | 0.00125545 |
| Minimum | 0 |
|
|
- Mean = 0.00130188
- Std.dev = 4.2522e-05
- 54 items below graph minimum of 0.0011602
- 76 items above graph maximum of 0.00144596
|
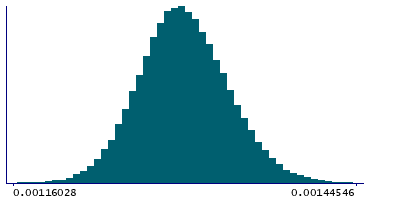
2 Instances
Instance 2 : Imaging visit (2014+)
79,151 participants, 79,151 items
| Maximum | 0.00166898 |
| Decile 9 | 0.00135098 |
| Decile 8 | 0.00133317 |
| Decile 7 | 0.00132084 |
| Decile 6 | 0.00131054 |
| Median | 0.00130099 |
| Decile 4 | 0.00129174 |
| Decile 3 | 0.00128217 |
| Decile 2 | 0.00127084 |
| Decile 1 | 0.0012554 |
| Minimum | 0 |
|

|
- Mean = 0.00130202
- Std.dev = 4.2672e-05
- 52 items below graph minimum of 0.00115982
- 69 items above graph maximum of 0.00144656
|
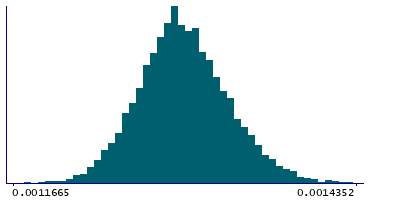
Instance 3 : First repeat imaging visit (2019+)
4,758 participants, 4,758 items
| Maximum | 0.00146302 |
| Decile 9 | 0.00134567 |
| Decile 8 | 0.00132843 |
| Decile 7 | 0.00131666 |
| Decile 6 | 0.00130697 |
| Median | 0.00129811 |
| Decile 4 | 0.00129005 |
| Decile 3 | 0.00128151 |
| Decile 2 | 0.00127124 |
| Decile 1 | 0.00125604 |
| Minimum | 0 |
|
|
- Mean = 0.00129959
- Std.dev = 3.98739e-05
- 1 item below graph minimum of 0.00116641
- 3 items above graph maximum of 0.0014353
|
Notes
Weighted-mean L1 in tract forceps minor (from dMRI data)
0 Related Data-Fields
There are no related data-fields

