Data
64,945 items of data are available, covering 60,417 participants.
Defined-instances run from 2 to 3, labelled using Instancing
2.
Units of measurement are AU.
| Maximum | 0.00157699 |
| Decile 9 | 0.00131543 |
| Decile 8 | 0.00129686 |
| Decile 7 | 0.00128454 |
| Decile 6 | 0.00127431 |
| Median | 0.00126499 |
| Decile 4 | 0.00125587 |
| Decile 3 | 0.00124633 |
| Decile 2 | 0.00123508 |
| Decile 1 | 0.00121947 |
| Minimum | 0 |
|

|
- Mean = 0.00126645
- Std.dev = 4.19968e-05
- 27 items below graph minimum of 0.00112351
- 113 items above graph maximum of 0.00141138
|
2 Instances
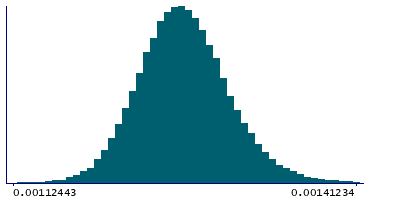
Instance 2 : Imaging visit (2014+)
60,185 participants, 60,185 items
| Maximum | 0.00157699 |
| Decile 9 | 0.00131637 |
| Decile 8 | 0.00129775 |
| Decile 7 | 0.00128554 |
| Decile 6 | 0.00127526 |
| Median | 0.00126594 |
| Decile 4 | 0.0012568 |
| Decile 3 | 0.00124715 |
| Decile 2 | 0.00123602 |
| Decile 1 | 0.0012204 |
| Minimum | 0 |
|
|
- Mean = 0.00126741
- Std.dev = 4.19381e-05
- 26 items below graph minimum of 0.00112443
- 104 items above graph maximum of 0.00141234
|
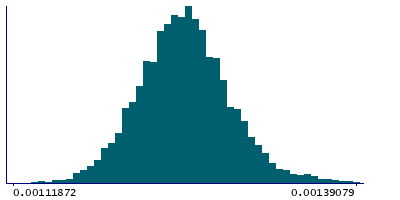
Instance 3 : First repeat imaging visit (2019+)
4,760 participants, 4,760 items
| Maximum | 0.00143698 |
| Decile 9 | 0.0013001 |
| Decile 8 | 0.00128273 |
| Decile 7 | 0.00127117 |
| Decile 6 | 0.00126203 |
| Median | 0.00125361 |
| Decile 4 | 0.00124488 |
| Decile 3 | 0.00123579 |
| Decile 2 | 0.00122461 |
| Decile 1 | 0.00120941 |
| Minimum | 0 |
|
|
- Mean = 0.00125425
- Std.dev = 4.08104e-05
- 1 item below graph minimum of 0.00111872
- 6 items above graph maximum of 0.00139079
|
Notes
Weighted-mean L1 in tract right inferior longitudinal fasciculus (from dMRI data)
0 Related Data-Fields
There are no related data-fields

