Data
83,909 items of data are available, covering 79,382 participants.
Defined-instances run from 2 to 3, labelled using Instancing
2.
Units of measurement are AU.
| Maximum | 0.00216983 |
| Decile 9 | 0.00118134 |
| Decile 8 | 0.00115833 |
| Decile 7 | 0.00114372 |
| Decile 6 | 0.00113236 |
| Median | 0.00112235 |
| Decile 4 | 0.00111306 |
| Decile 3 | 0.00110379 |
| Decile 2 | 0.00109345 |
| Decile 1 | 0.00107993 |
| Minimum | 0 |
|

|
- Mean = 0.00112732
- Std.dev = 4.39916e-05
- 36 items below graph minimum of 0.000978524
- 351 items above graph maximum of 0.00128275
|
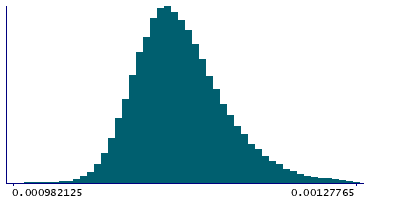
2 Instances
Instance 2 : Imaging visit (2014+)
79,151 participants, 79,151 items
| Maximum | 0.00157932 |
| Decile 9 | 0.00118162 |
| Decile 8 | 0.00115853 |
| Decile 7 | 0.00114393 |
| Decile 6 | 0.00113254 |
| Median | 0.00112245 |
| Decile 4 | 0.00111314 |
| Decile 3 | 0.0011038 |
| Decile 2 | 0.00109341 |
| Decile 1 | 0.00107986 |
| Minimum | 0 |
|
|
- Mean = 0.00112741
- Std.dev = 4.40815e-05
- 35 items below graph minimum of 0.000978105
- 332 items above graph maximum of 0.00128338
|
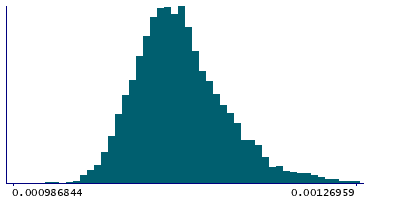
Instance 3 : First repeat imaging visit (2019+)
4,758 participants, 4,758 items
| Maximum | 0.00216983 |
| Decile 9 | 0.00117554 |
| Decile 8 | 0.00115419 |
| Decile 7 | 0.00113968 |
| Decile 6 | 0.00112922 |
| Median | 0.00112081 |
| Decile 4 | 0.00111203 |
| Decile 3 | 0.00110348 |
| Decile 2 | 0.00109414 |
| Decile 1 | 0.00108104 |
| Minimum | 0.000967596 |
|
|
- Mean = 0.00112576
- Std.dev = 4.24371e-05
- 1 item below graph minimum of 0.000986541
- 22 items above graph maximum of 0.00127004
|
Notes
Weighted-mean L1 in tract left superior thalamic radiation (from dMRI data)
0 Related Data-Fields
There are no related data-fields

