Data
83,909 items of data are available, covering 79,382 participants.
Defined-instances run from 2 to 3, labelled using Instancing
2.
Units of measurement are AU.
| Maximum | 0.00232687 |
| Decile 9 | 0.000703919 |
| Decile 8 | 0.000675991 |
| Decile 7 | 0.000658168 |
| Decile 6 | 0.000643818 |
| Median | 0.000631379 |
| Decile 4 | 0.000619668 |
| Decile 3 | 0.000607718 |
| Decile 2 | 0.000594791 |
| Decile 1 | 0.000577449 |
| Minimum | 0 |
|

|
- Mean = 0.000637029
- Std.dev = 5.59521e-05
- 53 items below graph minimum of 0.000450978
- 360 items above graph maximum of 0.00083039
|
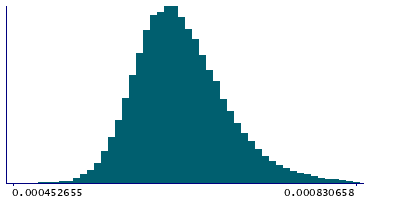
2 Instances
Instance 2 : Imaging visit (2014+)
79,151 participants, 79,151 items
| Maximum | 0.00232687 |
| Decile 9 | 0.000704569 |
| Decile 8 | 0.000676523 |
| Decile 7 | 0.000658707 |
| Decile 6 | 0.000644432 |
| Median | 0.00063188 |
| Decile 4 | 0.000620332 |
| Decile 3 | 0.000608288 |
| Decile 2 | 0.000595358 |
| Decile 1 | 0.000578015 |
| Minimum | 0 |
|
|
- Mean = 0.000637645
- Std.dev = 5.61227e-05
- 50 items below graph minimum of 0.00045146
- 353 items above graph maximum of 0.000831123
|
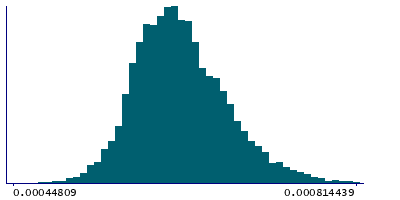
Instance 3 : First repeat imaging visit (2019+)
4,758 participants, 4,758 items
| Maximum | 0.000863615 |
| Decile 9 | 0.000692426 |
| Decile 8 | 0.000666791 |
| Decile 7 | 0.000648069 |
| Decile 6 | 0.000634013 |
| Median | 0.000621731 |
| Decile 4 | 0.000610614 |
| Decile 3 | 0.000598459 |
| Decile 2 | 0.00058614 |
| Decile 1 | 0.000570201 |
| Minimum | 0 |
|
|
- Mean = 0.000626784
- Std.dev = 5.19729e-05
- 3 items below graph minimum of 0.000447977
- 9 items above graph maximum of 0.00081465
|
Notes
Weighted-mean L2 in tract middle cerebellar peduncle (from dMRI data)
0 Related Data-Fields
There are no related data-fields

