Data
83,909 items of data are available, covering 79,382 participants.
Defined-instances run from 2 to 3, labelled using Instancing
2.
Units of measurement are AU.
| Maximum | 0.000824731 |
| Decile 9 | 0.000455117 |
| Decile 8 | 0.000438474 |
| Decile 7 | 0.000426758 |
| Decile 6 | 0.000417161 |
| Median | 0.000408284 |
| Decile 4 | 0.000399507 |
| Decile 3 | 0.000390358 |
| Decile 2 | 0.000379927 |
| Decile 1 | 0.000365644 |
| Minimum | 0 |
|

|
- Mean = 0.000409456
- Std.dev = 3.60502e-05
- 27 items below graph minimum of 0.000276171
- 61 items above graph maximum of 0.000544591
|
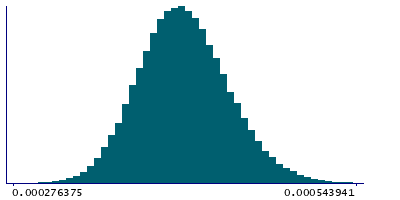
2 Instances
Instance 2 : Imaging visit (2014+)
79,151 participants, 79,151 items
| Maximum | 0.000824731 |
| Decile 9 | 0.000455169 |
| Decile 8 | 0.000438515 |
| Decile 7 | 0.000426766 |
| Decile 6 | 0.000417128 |
| Median | 0.00040823 |
| Decile 4 | 0.000399422 |
| Decile 3 | 0.000390254 |
| Decile 2 | 0.000379814 |
| Decile 1 | 0.000365473 |
| Minimum | 0 |
|
|
- Mean = 0.000409413
- Std.dev = 3.61077e-05
- 24 items below graph minimum of 0.000275776
- 59 items above graph maximum of 0.000544866
|
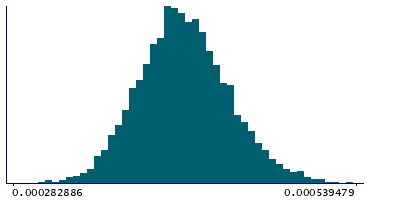
Instance 3 : First repeat imaging visit (2019+)
4,758 participants, 4,758 items
| Maximum | 0.000571231 |
| Decile 9 | 0.000453962 |
| Decile 8 | 0.000437725 |
| Decile 7 | 0.000426599 |
| Decile 6 | 0.000417751 |
| Median | 0.000409208 |
| Decile 4 | 0.000401039 |
| Decile 3 | 0.000392682 |
| Decile 2 | 0.000382449 |
| Decile 1 | 0.000368424 |
| Minimum | 0 |
|
|
- Mean = 0.00041018
- Std.dev = 3.50733e-05
- 3 items below graph minimum of 0.000282886
- 1 item above graph maximum of 0.0005395
|
Notes
Weighted-mean L3 in tract left cingulate gyrus part of cingulum (from dMRI data)
0 Related Data-Fields
There are no related data-fields

