Data
83,909 items of data are available, covering 79,382 participants.
Defined-instances run from 2 to 3, labelled using Instancing
2.
Units of measurement are AU.
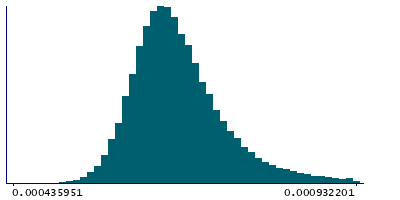
| Maximum | 0.00177012 |
| Decile 9 | 0.000773744 |
| Decile 8 | 0.000729543 |
| Decile 7 | 0.000703483 |
| Decile 6 | 0.000684612 |
| Median | 0.000668432 |
| Decile 4 | 0.000653902 |
| Decile 3 | 0.000639537 |
| Decile 2 | 0.000623853 |
| Decile 1 | 0.000602871 |
| Minimum | 0 |
|
|
- Mean = 0.000681341
- Std.dev = 7.69805e-05
- 24 items below graph minimum of 0.000431999
- 779 items above graph maximum of 0.000944617
|
2 Instances
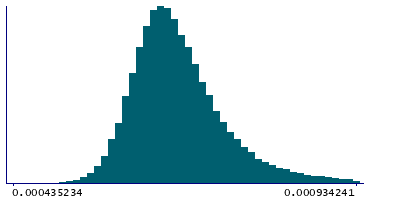
Instance 2 : Imaging visit (2014+)
79,151 participants, 79,151 items
| Maximum | 0.00177012 |
| Decile 9 | 0.000775037 |
| Decile 8 | 0.000730283 |
| Decile 7 | 0.000704054 |
| Decile 6 | 0.000685155 |
| Median | 0.000668802 |
| Decile 4 | 0.000654217 |
| Decile 3 | 0.000639809 |
| Decile 2 | 0.000624114 |
| Decile 1 | 0.000603102 |
| Minimum | 0 |
|
|
- Mean = 0.000681906
- Std.dev = 7.73256e-05
- 21 items below graph minimum of 0.000431166
- 737 items above graph maximum of 0.000946972
|
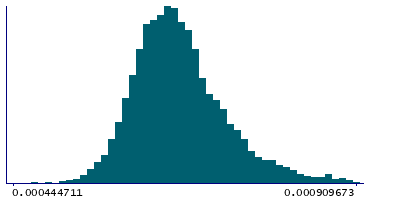
Instance 3 : First repeat imaging visit (2019+)
4,758 participants, 4,758 items
| Maximum | 0.00131501 |
| Decile 9 | 0.00075471 |
| Decile 8 | 0.000718094 |
| Decile 7 | 0.000693435 |
| Decile 6 | 0.00067711 |
| Median | 0.000662688 |
| Decile 4 | 0.00064931 |
| Decile 3 | 0.000635179 |
| Decile 2 | 0.000620013 |
| Decile 1 | 0.000599736 |
| Minimum | 0 |
|
|
- Mean = 0.000671934
- Std.dev = 7.03298e-05
- 3 items below graph minimum of 0.000444763
- 37 items above graph maximum of 0.000909683
|
Notes
Weighted-mean L3 in tract right parahippocampal part of cingulum (from dMRI data)
0 Related Data-Fields
There are no related data-fields

