Data
83,905 items of data are available, covering 79,378 participants.
Defined-instances run from 2 to 3, labelled using Instancing
2.
Units of measurement are AU.
| Maximum | 0.989798 |
| Decile 9 | 0.485692 |
| Decile 8 | 0.474585 |
| Decile 7 | 0.466756 |
| Decile 6 | 0.460296 |
| Median | 0.454233 |
| Decile 4 | 0.448167 |
| Decile 3 | 0.441566 |
| Decile 2 | 0.433836 |
| Decile 1 | 0.422825 |
| Minimum | 0 |
|
|
- Mean = 0.45423
- Std.dev = 0.0272318
- 65 items below graph minimum of 0.359958
- 77 items above graph maximum of 0.54856
|
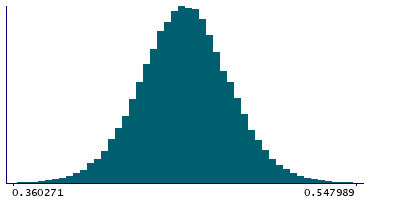
2 Instances
Instance 2 : Imaging visit (2014+)
79,147 participants, 79,147 items
| Maximum | 0.989798 |
| Decile 9 | 0.485628 |
| Decile 8 | 0.474442 |
| Decile 7 | 0.466628 |
| Decile 6 | 0.460164 |
| Median | 0.454053 |
| Decile 4 | 0.447967 |
| Decile 3 | 0.441374 |
| Decile 2 | 0.433627 |
| Decile 1 | 0.422578 |
| Minimum | 0 |
|

|
- Mean = 0.454082
- Std.dev = 0.0272858
- 61 items below graph minimum of 0.359528
- 74 items above graph maximum of 0.548678
|
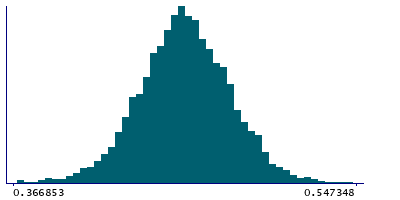
Instance 3 : First repeat imaging visit (2019+)
4,758 participants, 4,758 items
| Maximum | 0.819013 |
| Decile 9 | 0.487192 |
| Decile 8 | 0.476585 |
| Decile 7 | 0.469028 |
| Decile 6 | 0.462474 |
| Median | 0.456705 |
| Decile 4 | 0.451325 |
| Decile 3 | 0.445075 |
| Decile 2 | 0.437609 |
| Decile 1 | 0.427017 |
| Minimum | 0 |
|
|
- Mean = 0.456682
- Std.dev = 0.0261961
- 3 items below graph minimum of 0.366841
- 2 items above graph maximum of 0.547368
|
Notes
Weighted-mean ICVF (intra-cellular volume fraction) in tract left parahippocampal part of cingulum (from dMRI data)
0 Related Data-Fields
There are no related data-fields

