Data
83,905 items of data are available, covering 79,378 participants.
Defined-instances run from 2 to 3, labelled using Instancing
2.
Units of measurement are AU.
| Maximum | 0.989132 |
| Decile 9 | 0.714897 |
| Decile 8 | 0.70524 |
| Decile 7 | 0.698231 |
| Decile 6 | 0.692107 |
| Median | 0.686232 |
| Decile 4 | 0.68046 |
| Decile 3 | 0.674027 |
| Decile 2 | 0.666212 |
| Decile 1 | 0.654738 |
| Minimum | 0 |
|
|
- Mean = 0.685108
- Std.dev = 0.0276217
- 192 items below graph minimum of 0.594579
- 28 items above graph maximum of 0.775057
|
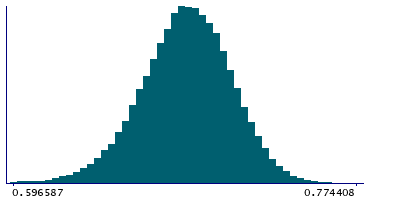
2 Instances
Instance 2 : Imaging visit (2014+)
79,147 participants, 79,147 items
| Maximum | 0.989132 |
| Decile 9 | 0.714876 |
| Decile 8 | 0.705189 |
| Decile 7 | 0.698206 |
| Decile 6 | 0.692063 |
| Median | 0.686156 |
| Decile 4 | 0.680346 |
| Decile 3 | 0.673927 |
| Decile 2 | 0.666096 |
| Decile 1 | 0.654576 |
| Minimum | 0 |
|

|
- Mean = 0.685038
- Std.dev = 0.0275399
- 182 items below graph minimum of 0.594276
- 27 items above graph maximum of 0.775177
|
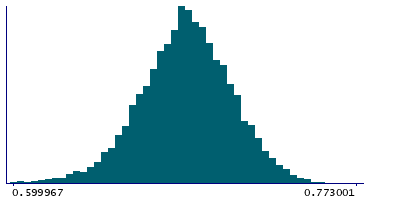
Instance 3 : First repeat imaging visit (2019+)
4,758 participants, 4,758 items
| Maximum | 0.816863 |
| Decile 9 | 0.715345 |
| Decile 8 | 0.705806 |
| Decile 7 | 0.698719 |
| Decile 6 | 0.692895 |
| Median | 0.68733 |
| Decile 4 | 0.682137 |
| Decile 3 | 0.675666 |
| Decile 2 | 0.668278 |
| Decile 1 | 0.657643 |
| Minimum | 0 |
|
|
- Mean = 0.68627
- Std.dev = 0.0289244
- 10 items below graph minimum of 0.599942
- 1 item above graph maximum of 0.773046
|
Notes
Weighted-mean ICVF (intra-cellular volume fraction) in tract left corticospinal tract (from dMRI data)
0 Related Data-Fields
There are no related data-fields

