Data
64,941 items of data are available, covering 60,413 participants.
Defined-instances run from 2 to 3, labelled using Instancing
2.
Units of measurement are AU.
| Maximum | 0.989374 |
| Decile 9 | 0.709277 |
| Decile 8 | 0.699524 |
| Decile 7 | 0.692425 |
| Decile 6 | 0.686223 |
| Median | 0.680372 |
| Decile 4 | 0.674456 |
| Decile 3 | 0.667937 |
| Decile 2 | 0.660078 |
| Decile 1 | 0.648462 |
| Minimum | 0 |
|

|
- Mean = 0.67915
- Std.dev = 0.0284903
- 138 items below graph minimum of 0.587647
- 32 items above graph maximum of 0.770092
|
2 Instances
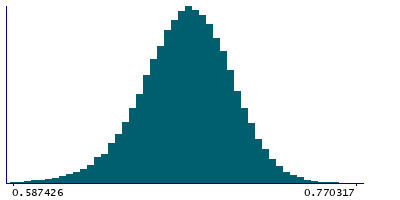
Instance 2 : Imaging visit (2014+)
60,181 participants, 60,181 items
| Maximum | 0.989374 |
| Decile 9 | 0.709353 |
| Decile 8 | 0.699557 |
| Decile 7 | 0.692439 |
| Decile 6 | 0.686235 |
| Median | 0.68036 |
| Decile 4 | 0.674405 |
| Decile 3 | 0.667856 |
| Decile 2 | 0.660032 |
| Decile 1 | 0.64839 |
| Minimum | 0 |
|
|
- Mean = 0.679135
- Std.dev = 0.0284377
- 133 items below graph minimum of 0.587426
- 31 items above graph maximum of 0.770317
|
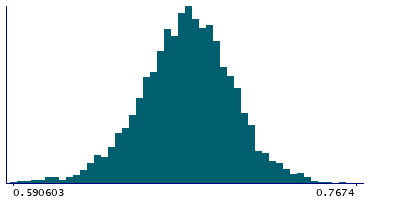
Instance 3 : First repeat imaging visit (2019+)
4,760 participants, 4,760 items
| Maximum | 0.784481 |
| Decile 9 | 0.708468 |
| Decile 8 | 0.698997 |
| Decile 7 | 0.692177 |
| Decile 6 | 0.686132 |
| Median | 0.680575 |
| Decile 4 | 0.675098 |
| Decile 3 | 0.668595 |
| Decile 2 | 0.660944 |
| Decile 1 | 0.649535 |
| Minimum | 0 |
|
|
- Mean = 0.679339
- Std.dev = 0.0291468
- 6 items below graph minimum of 0.590603
- 1 item above graph maximum of 0.7674
|
Notes
Weighted-mean ICVF (intra-cellular volume fraction) in tract right corticospinal tract (from dMRI data)
0 Related Data-Fields
There are no related data-fields

