Data
83,905 items of data are available, covering 79,378 participants.
Defined-instances run from 2 to 3, labelled using Instancing
2.
Units of measurement are AU.
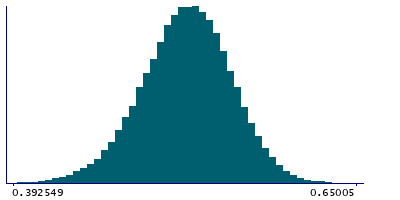
| Maximum | 0.989879 |
| Decile 9 | 0.563064 |
| Decile 8 | 0.549035 |
| Decile 7 | 0.538899 |
| Decile 6 | 0.52995 |
| Median | 0.521433 |
| Decile 4 | 0.512855 |
| Decile 3 | 0.503568 |
| Decile 2 | 0.492135 |
| Decile 1 | 0.475697 |
| Minimum | 0 |
|
|
- Mean = 0.520162
- Std.dev = 0.0362597
- 99 items below graph minimum of 0.388329
- 21 items above graph maximum of 0.650431
|
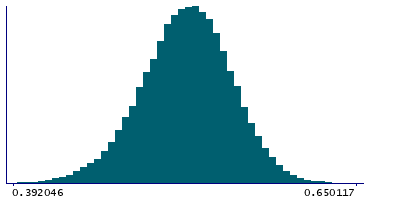
2 Instances
Instance 2 : Imaging visit (2014+)
79,147 participants, 79,147 items
| Maximum | 0.989879 |
| Decile 9 | 0.562881 |
| Decile 8 | 0.548846 |
| Decile 7 | 0.538709 |
| Decile 6 | 0.52973 |
| Median | 0.521196 |
| Decile 4 | 0.512523 |
| Decile 3 | 0.503246 |
| Decile 2 | 0.49179 |
| Decile 1 | 0.475308 |
| Minimum | 0 |
|
|
- Mean = 0.519892
- Std.dev = 0.0363401
- 96 items below graph minimum of 0.387736
- 20 items above graph maximum of 0.650453
|
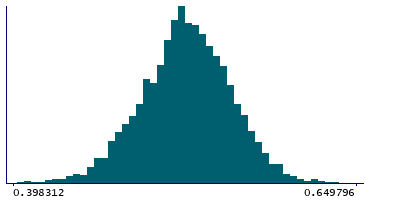
Instance 3 : First repeat imaging visit (2019+)
4,758 participants, 4,758 items
| Maximum | 0.843599 |
| Decile 9 | 0.565971 |
| Decile 8 | 0.552064 |
| Decile 7 | 0.542024 |
| Decile 6 | 0.533339 |
| Median | 0.525199 |
| Decile 4 | 0.518033 |
| Decile 3 | 0.509593 |
| Decile 2 | 0.497927 |
| Decile 1 | 0.482108 |
| Minimum | 0 |
|
|
- Mean = 0.524653
- Std.dev = 0.034586
- 4 items below graph minimum of 0.398245
- 1 item above graph maximum of 0.649834
|
Notes
Weighted-mean ICVF (intra-cellular volume fraction) in tract right inferior fronto-occipital fasciculus (from dMRI data)
0 Related Data-Fields
There are no related data-fields

