Data
64,941 items of data are available, covering 60,413 participants.
Defined-instances run from 2 to 3, labelled using Instancing
2.
Units of measurement are AU.
| Maximum | 0.986547 |
| Decile 9 | 0.634074 |
| Decile 8 | 0.624355 |
| Decile 7 | 0.617445 |
| Decile 6 | 0.611722 |
| Median | 0.606403 |
| Decile 4 | 0.601262 |
| Decile 3 | 0.595675 |
| Decile 2 | 0.589256 |
| Decile 1 | 0.580409 |
| Minimum | 0 |
|

|
- Mean = 0.607014
- Std.dev = 0.0234035
- 18 items below graph minimum of 0.526744
- 95 items above graph maximum of 0.687739
|
2 Instances
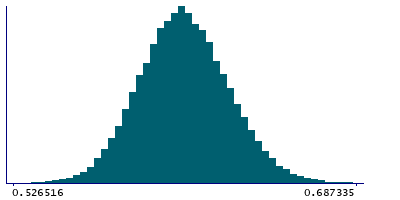
Instance 2 : Imaging visit (2014+)
60,181 participants, 60,181 items
| Maximum | 0.986547 |
| Decile 9 | 0.633729 |
| Decile 8 | 0.623987 |
| Decile 7 | 0.617065 |
| Decile 6 | 0.61131 |
| Median | 0.606046 |
| Decile 4 | 0.600911 |
| Decile 3 | 0.595316 |
| Decile 2 | 0.588883 |
| Decile 1 | 0.580122 |
| Minimum | 0 |
|
|
- Mean = 0.606664
- Std.dev = 0.0233499
- 16 items below graph minimum of 0.526516
- 89 items above graph maximum of 0.687335
|
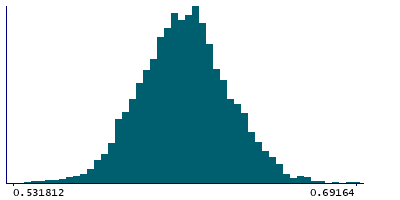
Instance 3 : First repeat imaging visit (2019+)
4,760 participants, 4,760 items
| Maximum | 0.981508 |
| Decile 9 | 0.638364 |
| Decile 8 | 0.628704 |
| Decile 7 | 0.621607 |
| Decile 6 | 0.616422 |
| Median | 0.611414 |
| Decile 4 | 0.606318 |
| Decile 3 | 0.600741 |
| Decile 2 | 0.594093 |
| Decile 1 | 0.585088 |
| Minimum | 0 |
|
|
- Mean = 0.611443
- Std.dev = 0.0236268
- 2 items below graph minimum of 0.531812
- 4 items above graph maximum of 0.69164
|
Notes
Weighted-mean ICVF (intra-cellular volume fraction) in tract left medial lemniscus (from dMRI data)
0 Related Data-Fields
There are no related data-fields

